Endpoint Activity
Track and visualize API endpoint usage directly in the dashboard. Monitor endpoint-level activity analytics, spend breakdowns, and performance metrics to understand which endpoints are receiving the most traffic and how they're performing.
Overview
Endpoint Activity enables you to track spend and usage for individual API endpoints automatically. Every time you call an endpoint through the LiteLLM proxy, activity is automatically tracked and aggregated. This allows you to:
- Track spend per endpoint automatically
- View endpoint-level usage analytics in the Admin UI
- Monitor token consumption by endpoint
- Analyze success and failure rates per endpoint
- Identify which endpoints are getting the most activity
- View trend data showing endpoint usage over time
How Endpoint Activity Works
Endpoint activity is automatically tracked whenever you make API calls through the LiteLLM proxy. No additional configuration is required - simply call your endpoints as usual and activity will be tracked.
Example API Call
When you make a request to any endpoint, activity is automatically recorded:
curl -X POST 'http://0.0.0.0:4000/chat/completions' \ # 👈 ENDPOINT AUTOMATICALLY TRACKED
  --header 'Content-Type: application/json' \
  --header 'Authorization: Bearer sk-1234' \ # 👈 YOUR PROXY KEY
  --data '{
    "model": "gpt-3.5-turbo",
    "messages": [
      {
        "role": "user",
        "content": "What is the capital of France?"
      }
    ]
  }'
The endpoint (/chat/completions) will be automatically tracked with:
- Token counts (prompt tokens, completion tokens, total tokens)
- Spend for the request
- Request status (success or failure)
- Timestamp and other metadata
How to View Endpoint Activity
View Activity in Admin UI
Navigate to the Endpoint Activity tab in the Admin UI to view endpoint-level analytics:
1. Access Endpoint Activity
Go to the Usage page in the Admin UI (PROXY_BASE_URL/ui/?login=success&page=new_usage) and click on the Endpoint Activity tab.
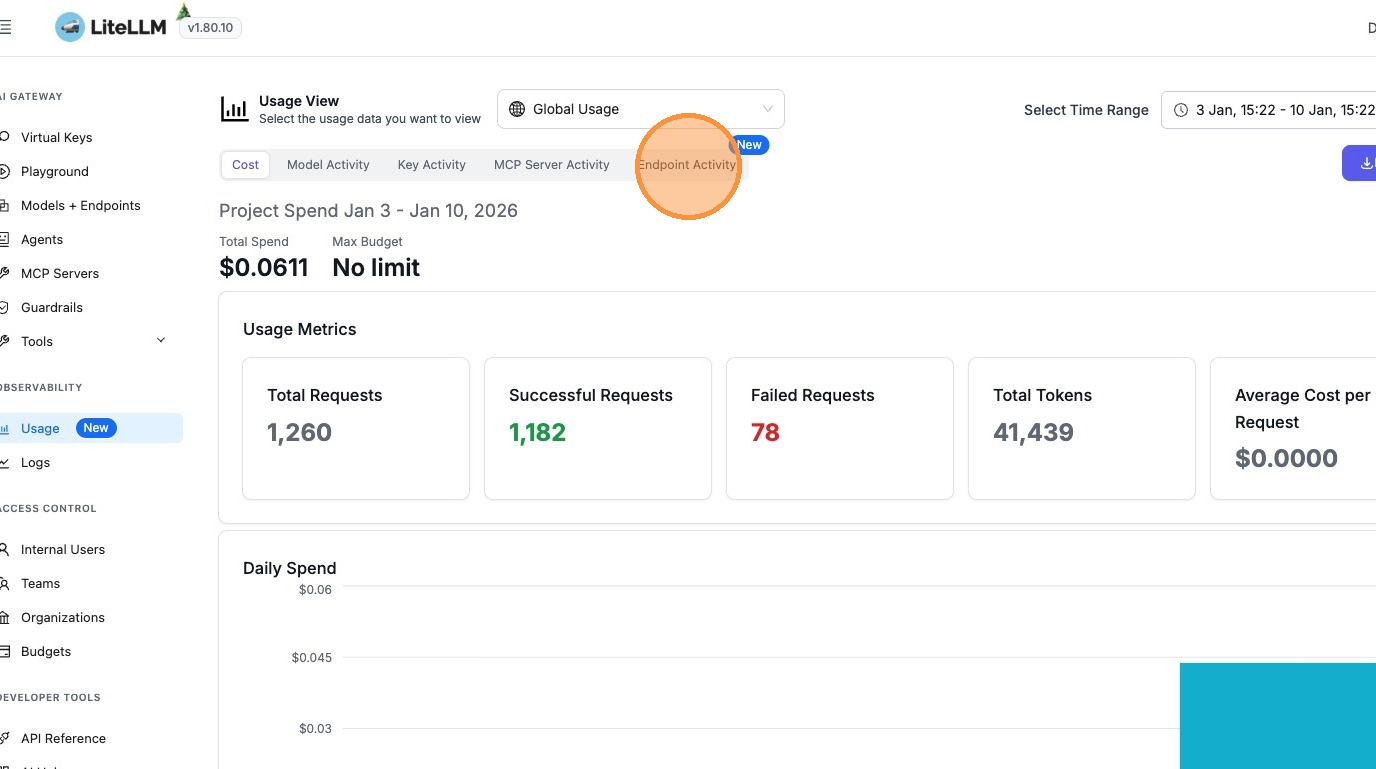
2. View Endpoint Analytics
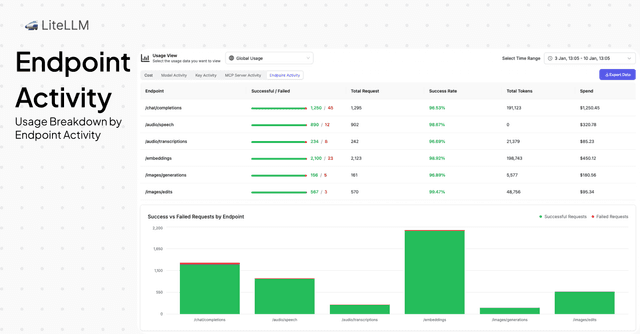
The Endpoint Activity dashboard provides:
- Endpoint usage table: View all endpoints with aggregated metrics including:
- Total requests (successful and failed)
- Success rate percentage
- Total tokens consumed
- Total spend per endpoint
- Success vs Failed requests chart: Visualize request success and failure rates by endpoint
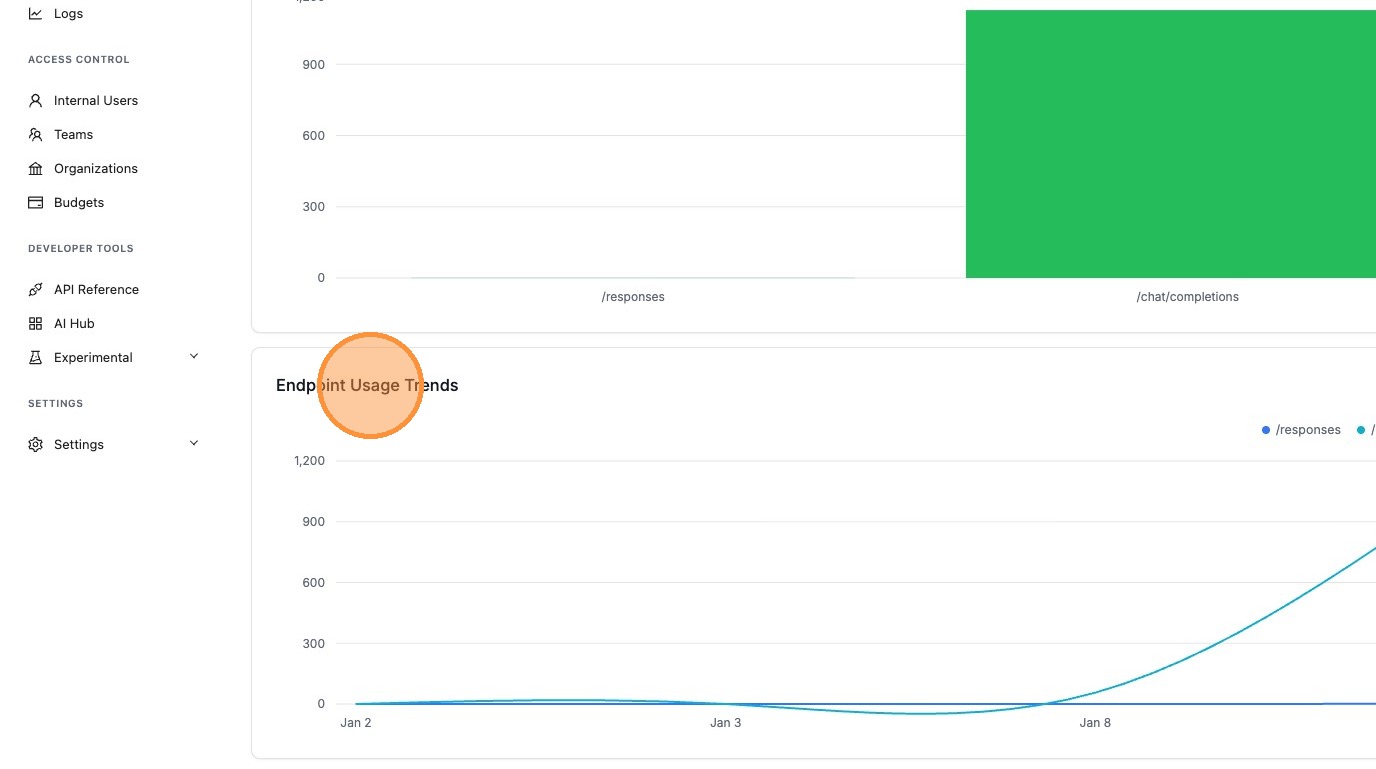
- Usage trends: See how endpoint activity changes over time with daily trend data
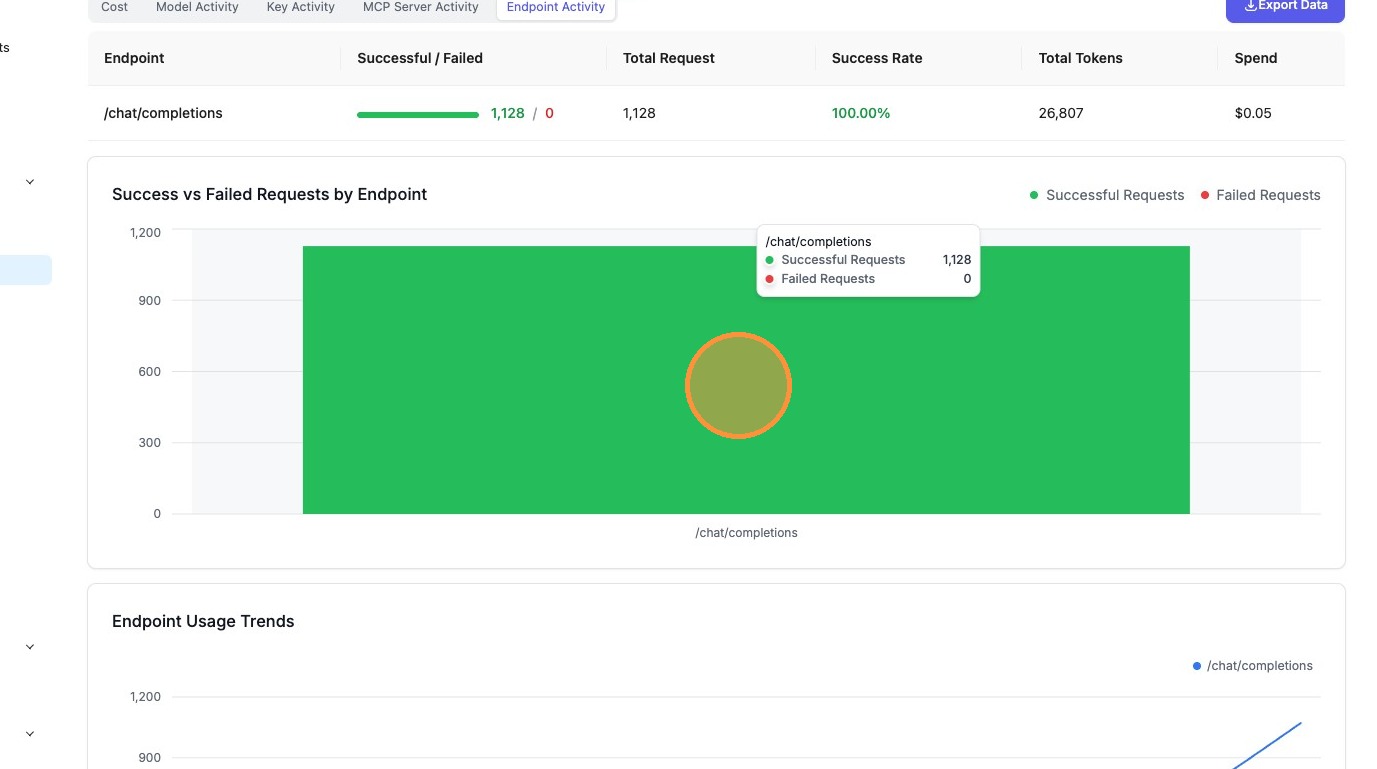
3. Understand Endpoint Metrics
Each endpoint displays the following metrics:
- Successful Requests: Number of requests that completed successfully
- Failed Requests: Number of requests that encountered errors
- Total Requests: Sum of successful and failed requests
- Success Rate: Percentage of successful requests
- Total Tokens: Sum of prompt and completion tokens
- Spend: Total cost for all requests to that endpoint
Use Cases
Performance Monitoring
Monitor endpoint health and performance:
- Identify endpoints with high failure rates
- Track which endpoints are receiving the most traffic
- Monitor token consumption patterns by endpoint
- Detect anomalies in endpoint usage
Cost Optimization
Understand spend distribution across endpoints:
- Identify high-cost endpoints
- Optimize expensive endpoints
- Allocate budget based on endpoint usage
- Track cost trends over time
Related Features
- Customer Usage - Track spend and usage for individual customers
- Cost Tracking - Comprehensive cost tracking and analytics
- Spend Logs - Detailed request-level spend logs