Public Benchmarks
These posts publish measurements with real provider APIs and their configurations. The JEV classifier comparison times the classifier directly and includes a separate live proxy check. Numbers below are quoted from the posts
JEV Classifier: 5.43x as Fast as Haiku, 96% Lower Cost
On 2026-09-18, TypeSafe jev-1.13.0 and anthropic/claude-haiku-4-5-20251001 classified the same 80 authored synthetic cases, with three paired repeats and concurrency one
| Metric | JEV | Haiku |
|---|---|---|
| Match with authored expected tiers | 95.00% (228/240) | 73.75% (177/240) |
| p50 classifier latency | 126.81 ms | 688.40 ms |
| p95 classifier latency | 231.16 ms | 896.94 ms |
| Registry-priced classifier cost, 240 calls | $0.007706664 | $0.198534 |
| Provider errors / timeouts / fallbacks | 0 / 0 / 0 | 0 / 0 / 0 |
JEV classified requests 5.43x as fast as Haiku by median latency and 3.88x as fast at p95, with 96.12% lower registry-priced classifier cost. Tier agreement between classifiers was 78.75%, a separate measure from matching the authored labels. The eight boundary cases had a match-rate difference interval that included zero
These results measure the classifier on this corpus, with a shared custom rubric and explicit context settings. Requests, tier definitions, instructions and context can change either classifier's match rate. The expected labels were not independently reviewed, and alternative classifier prompts were not evaluated. These results do not establish general classification accuracy, downstream answer quality, invoice savings, or performance under concurrent load. The separate gateway check used the same downstream model for every tier, so it cannot establish savings from switching completion models
Read the methodology, per-tier results, uncertainty and limitations, or download the frozen evidence and reproduction scripts
Terminal-Bench 2.0: Opus-level quality at 27% lower cost
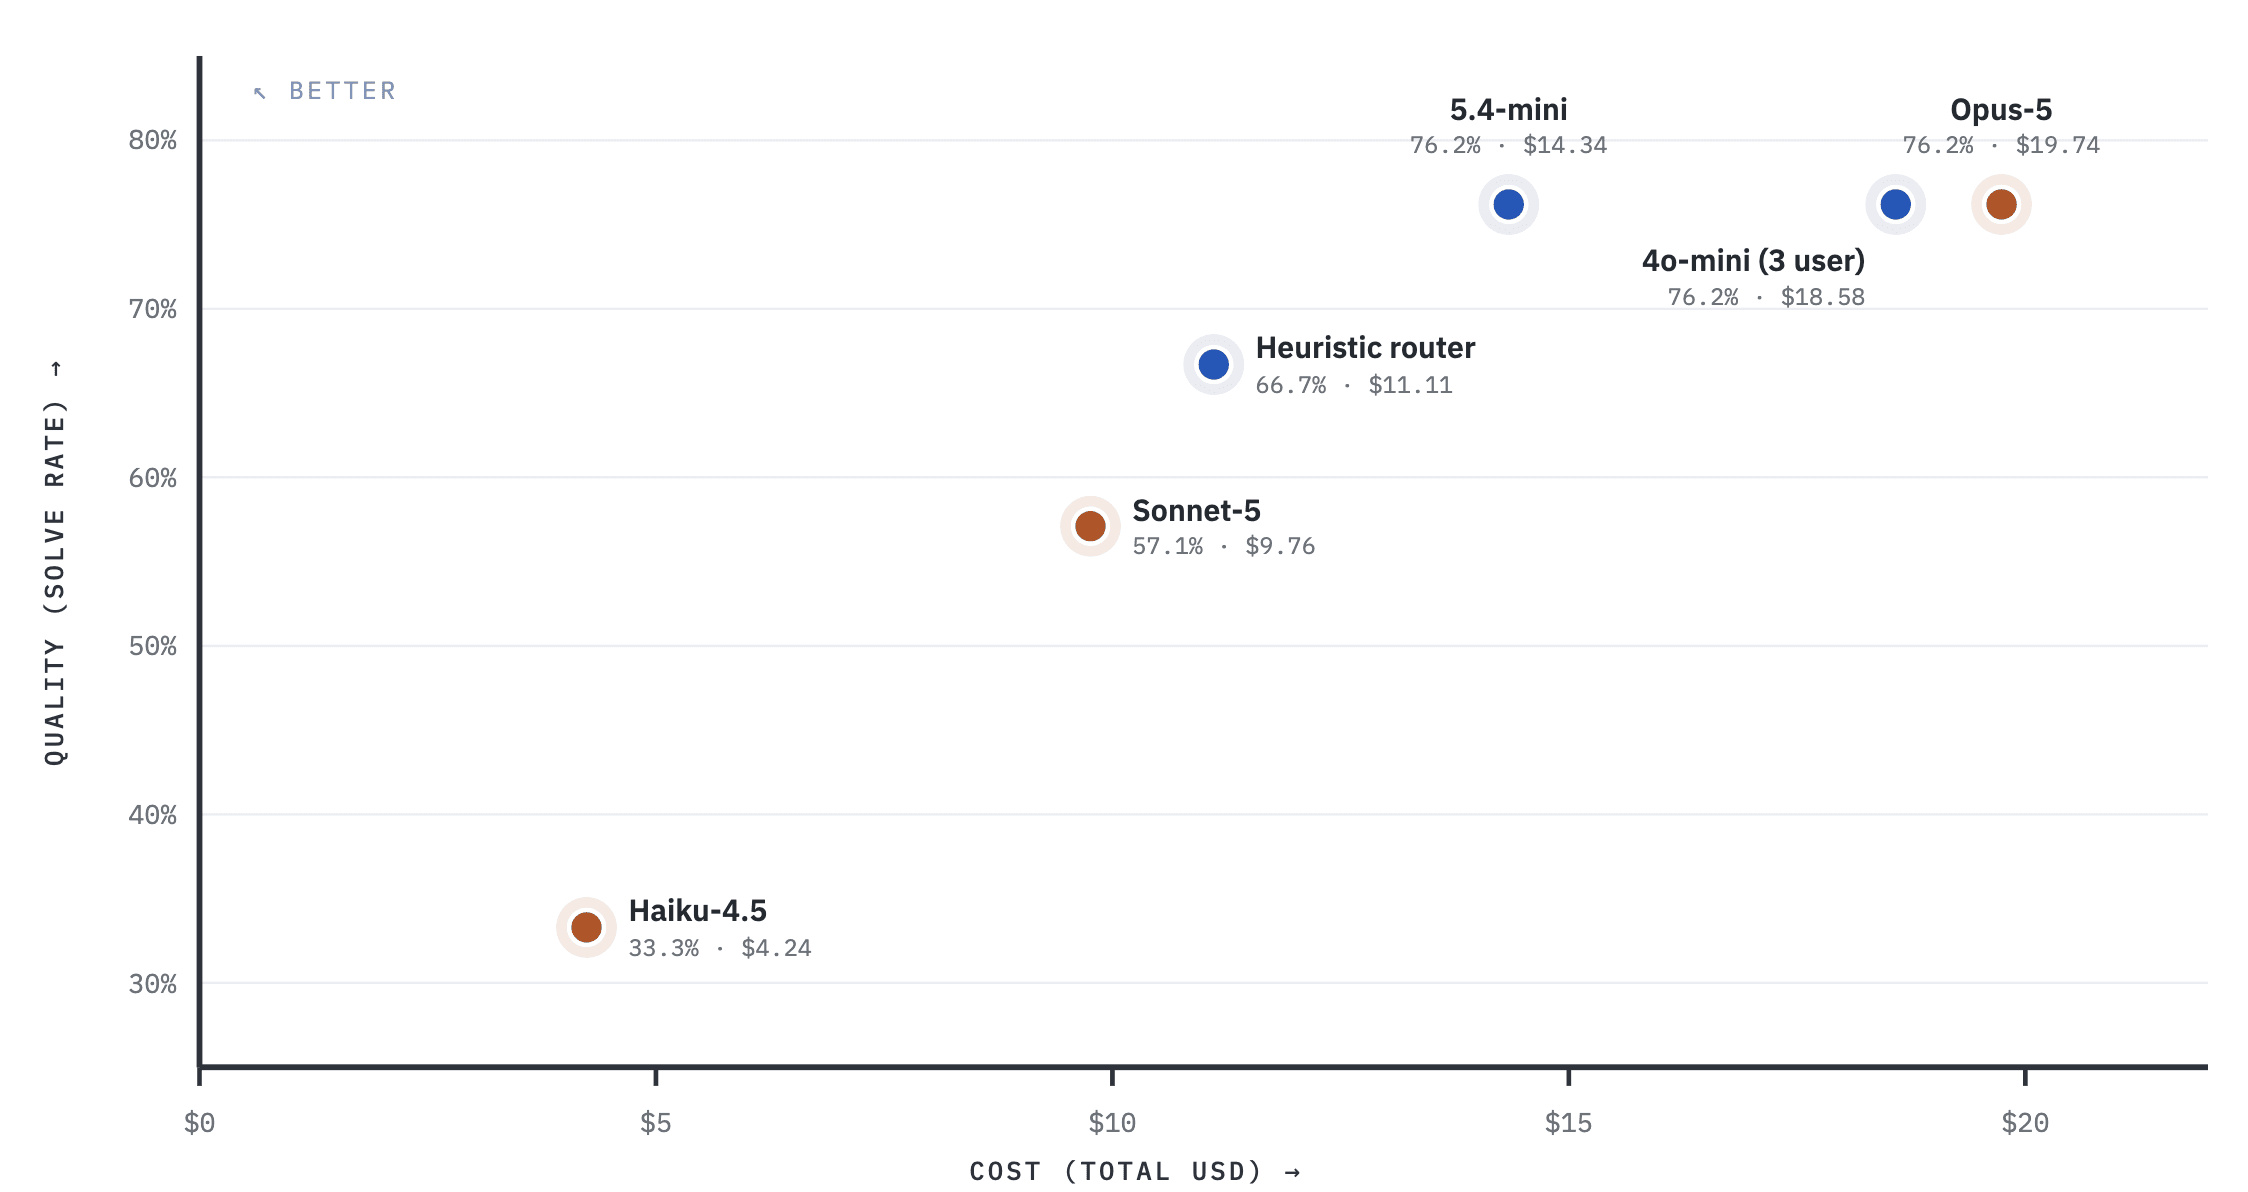
- 16/21 solved by the router and by Claude Opus-5 alone. Same solve rate.
- $14.34 vs $19.74 total cost. 27% lower.
- Classifier: gpt-5.4-mini reading only the current message.
- Widening context to the last 3 user messages: solve rate 66.7% to 76.2%, cost +44%.
- Adding assistant replies to the classifier's view: quality down, cost up. The shipped default keeps them out.
Heuristic v2: 27% more tasks solved at 45% lower cost per task
| Classifier | Solve rate | Solved/21 | Total cost | $/solved | Mean call latency | p90 call latency | Median task time |
|---|---|---|---|---|---|---|---|
| Heuristic v2 | 66.7% | 14/21 | $9.78 | $0.70 | 13.1s | 30.7s | 7m08s |
| Heuristic v1 | 52.4% | 11/21 | $14.06 | $1.28 | 14.5s | 34.1s | 8m53s |
- Same 21-task Terminal-Bench 2.0 subset, identical tiers, only
classifier_typediffers. - No LLM classifier call on the request path. Pretrained on graded response data, so no cold start.
- 87% of input tokens were cache reads, against 82% for v1: steadier tier choices mean fewer cache misses.
- Zero failed requests in either arm across 933 LLM calls.
- Enable with
classifier_type: heuristic_v2.
Six public benchmarks and RouterArena: 40% to 75% cheaper
| Evaluation | Sample | Cost vs all-Opus-5 | Quality vs frontier |
|---|---|---|---|
| Six public benchmarks, live proxy | 220 graded prompts | 40.4% cheaper | 97.1% (91.8% vs 94.5% pass) |
| RouterArena | 8,399 queries | 74.5% cheaper | 87.3% |
| WildChat-1M simulation | 12,000 conversations | 64.9% cheaper | not measured |
| DevGPT simulation | 2,056 conversations | 65.4% cheaper | not measured |
| Code-filtered WildChat | 993 conversations | 20.0% cheaper | not measured |
Classifier context: 14% to 78% agreement on follow-ups
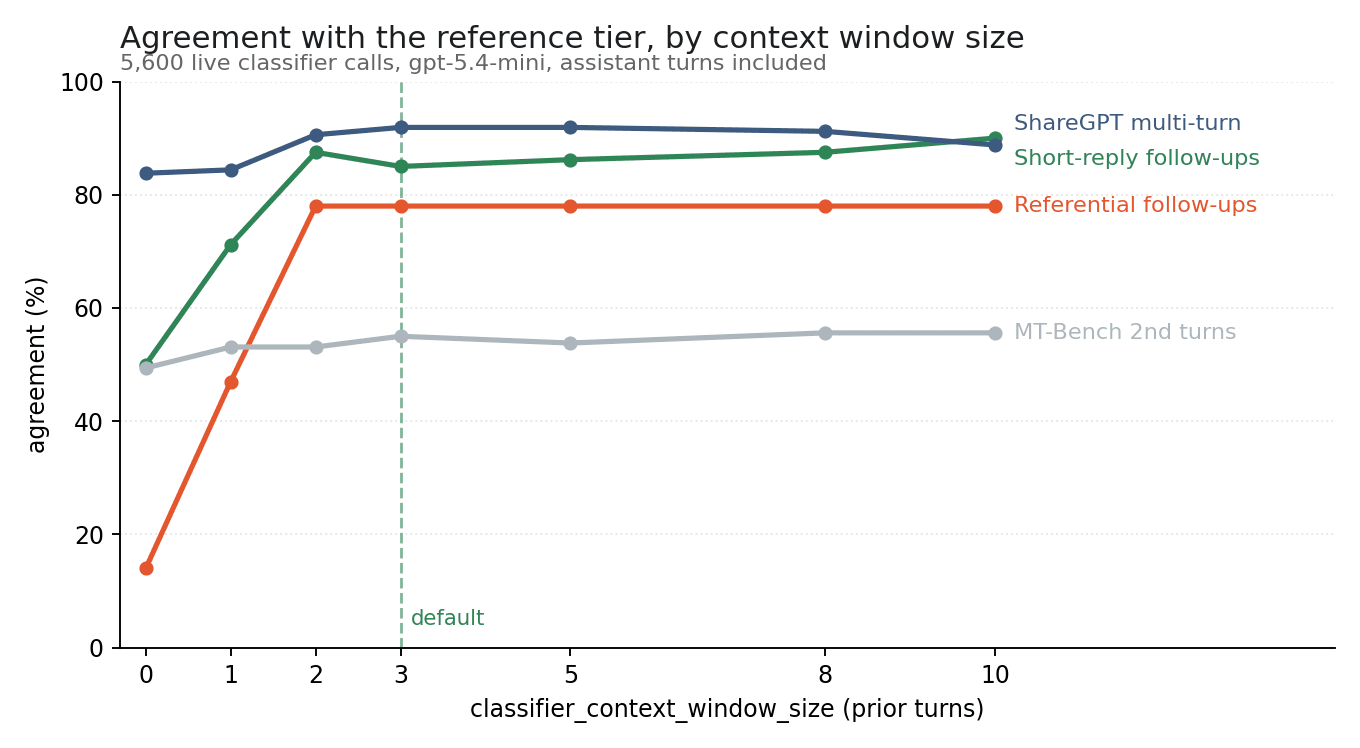
- 5,600 live classifier calls.
- Agreement on follow-ups that only resolve against history: 14% at 0 turns, 47% at 1, 78% at 2, flat out to 10.
- Classifier cost: at most $0.61 per 1,000 requests.
- Latency deltas versus no context: every 95% interval contains zero.
- Shipped default: 3 prior user turns, 200 characters each, no assistant turns.
Production: 51% saved across 272,876 requests
- 450+ users, dev, staging, and production, 2026-04-15 to 2026-08-09.
- 272,876 requests, 7.08B tokens.
- $11,736 spent vs $23,985 flagship-only counterfactual: $12,249 saved, 51.1%.
- Savings rate rose from 42.9% in the first full month to 60.7% in the last as the tier map was tuned.
- 95% of requests never reached the flagship tier.
Shadow evaluation: 88.1% matched or beat the current model
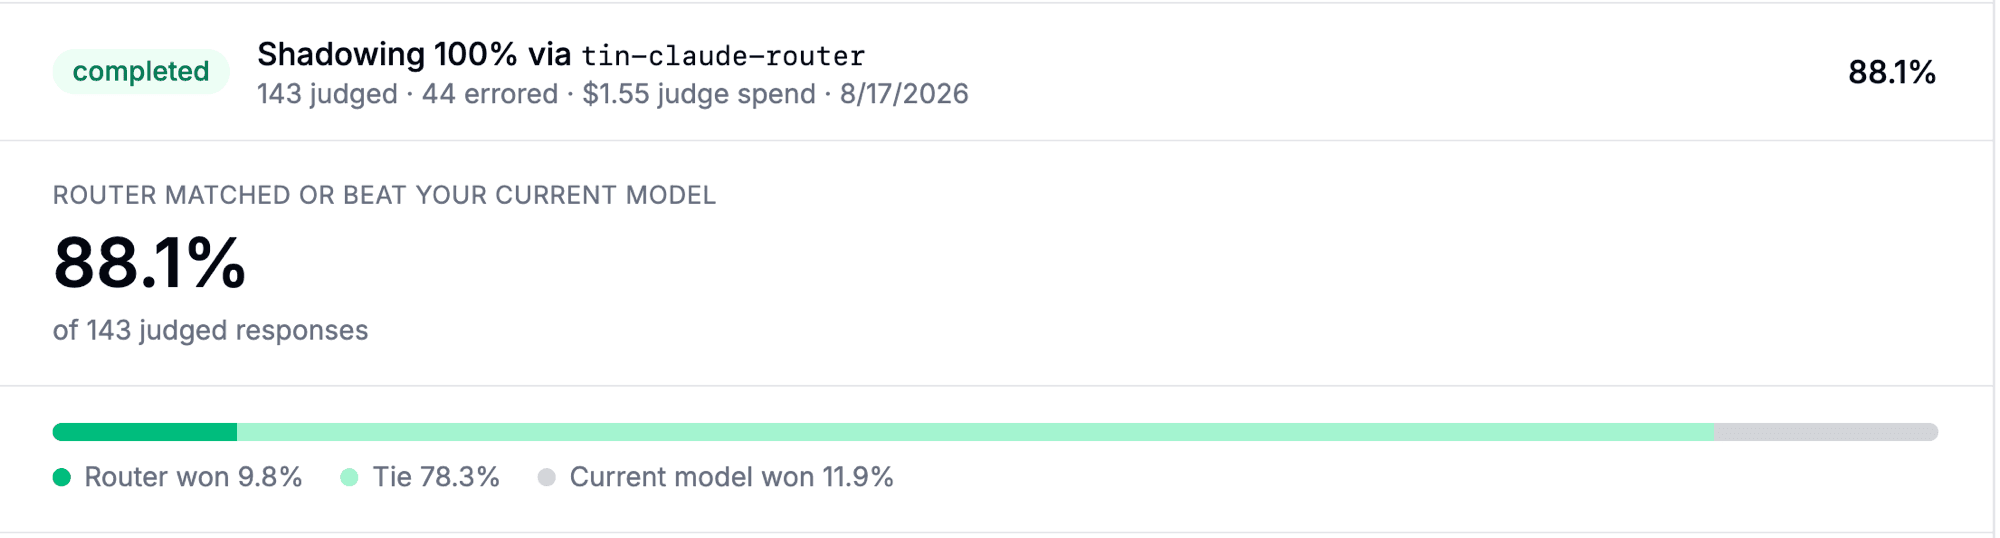
- Blind LLM judge on our own live gateway traffic, before any user-facing response changed.
- 143 judged turns, $1.55 judge spend.
- Router won 9.8%, tie 78.3%, current model won 11.9%.
- How to run one on your traffic: Evaluate on Your Traffic.
Prompt caching: 37% to 69% cheaper than caching alone
- Five datasets, including live gateway traffic with the provider's own cache accounting.
- Router plus caching beat caching one fixed model on every dataset.
- Full treatment: Prompt Caching.