Send your first trace
Send a model call to Lens and open it in Traces. These steps work with standalone Lens and with Lens inside the LiteLLM dashboard.
You need a running Lens service, Python 3.13, and a model key. If Lens is not ready, follow Set up Lens first. The example makes one model call, which can incur a provider charge.
If you already have an agent, you can instead follow its framework guide and keep its existing model settings.
1. Get a tracing key and endpoint
Open Lens through the place you intend to use it:
| Your setup | Open Lens here |
|---|---|
| Connected to LiteLLM | Sign in to LiteLLM and select Lens in the sidebar. |
| Standalone | Open your Lens URL at /ui/ and sign in with LENS_ADMIN_TOKEN. |
On Lens Home, expand Tracing key and select Generate tracing key. If your Lens version shows the tracing setup panel instead, use Generate tracing key there. If the button is unavailable, ask your Lens or gateway administrator for a dedicated tracing key.
Copy the key into your local environment. Copy the full trace endpoint from Set up manually or Connection details in the setup panel. It ends in /v1/traces. For the local quickstart, it is http://localhost:4318/v1/traces.
The tracing key uploads telemetry. It does not call models or read traces. Keep it separate from your model key and admin token.
2. Prepare the example
In an empty working directory, create a Python environment and install the tracing dependencies:
python3 -m venv .venv
source .venv/bin/activate
python -m pip install openai openinference-instrumentation-openai \
  opentelemetry-sdk opentelemetry-exporter-otlp-proto-http
Set the endpoint and tracing key from step 1 in this terminal:
export OTEL_EXPORTER_OTLP_TRACES_ENDPOINT="YOUR_FULL_TRACE_ENDPOINT"
export LENS_TRACING_KEY="YOUR_LENS_TRACING_KEY"
Replace the placeholders. Keep an existing path prefix such as /lens-ingest, and include /v1/traces once. The Python process must be able to reach this address.
Then select your model connection:
- Direct provider
- Through LiteLLM
This example calls OpenAI directly. Use your OpenAI API key and a model available to that key:
export OPENAI_API_KEY="YOUR_OPENAI_API_KEY"
export OPENAI_BASE_URL="https://api.openai.com/v1"
export LENS_EXAMPLE_MODEL="YOUR_OPENAI_MODEL"
For another OpenAI-compatible provider, use its API key, base URL, and model name. For other provider APIs, use the corresponding framework guide.
Use a LiteLLM key with model access, the gateway's OpenAI-compatible base URL, and a model alias from Models:
export OPENAI_API_KEY="YOUR_LITELLM_MODEL_KEY"
export OPENAI_BASE_URL="https://gateway.example.com/v1"
export LENS_EXAMPLE_MODEL="YOUR_LITELLM_MODEL_ALIAS"
Replace the example host with your gateway. These values are for model calls. The separate tracing settings still send telemetry to Lens.
The example records prompt and response text. Use a test prompt that you can store in Lens.
3. Run one traced call
Save this file as first_trace.py:
import os

from openai import OpenAI
from openinference.instrumentation.openai import OpenAIInstrumentor
from opentelemetry import trace
from opentelemetry.exporter.otlp.proto.http.trace_exporter import OTLPSpanExporter
from opentelemetry.sdk.resources import Resource
from opentelemetry.sdk.trace import TracerProvider
from opentelemetry.sdk.trace.export import BatchSpanProcessor

provider = TracerProvider(resource=Resource.create({"service.name": "lens-example"}))
provider.add_span_processor(BatchSpanProcessor(OTLPSpanExporter(
    endpoint=os.environ["OTEL_EXPORTER_OTLP_TRACES_ENDPOINT"],
    headers={"Authorization": f"Bearer {os.environ['LENS_TRACING_KEY']}"},
)))
trace.set_tracer_provider(provider)
OpenAIInstrumentor().instrument(tracer_provider=provider)

try:
    with trace.get_tracer("lens-example").start_as_current_span(
        "first_agent",
        attributes={"openinference.span.kind": "AGENT", "gen_ai.agent.name": "first_agent"},
    ) as span:
        prompt = "Explain an agent trace in one sentence."
        span.set_attribute("input.value", prompt)
        response = OpenAI().chat.completions.create(
            model=os.environ["LENS_EXAMPLE_MODEL"],
            messages=[{"role": "user", "content": prompt}],
            max_completion_tokens=128,
        )
        answer = response.choices[0].message.content or ""
        span.set_attribute("output.value", answer)
        print(answer)
        print(f"Trace ID: {span.get_span_context().trace_id:032x}")
finally:
    provider.shutdown()
Run it in the same terminal:
python first_trace.py
Expect a response and a trace ID. Wait for the process to exit so the exporter finishes sending the trace.
4. Open the trace in Lens
Return to Lens and select the first_agent agent, then Traces. If setup shows Check for traces, select it. Open the run with the trace ID printed by the example.
You should see the prompt, response, and a child model span. Demo data shows samples; turn it off when checking your own trace.
The example has no tools, so it will not contain tool-call spans. Costs appear only when Lens can match the call to a gateway spend record. A direct-provider trace does not acquire a price from this example.
Connect your existing agent
Keep your agent's model connection and add instrumentation for its framework. If it already has an OpenTelemetry tracer provider, add or update the exporter on that provider.
| Agent or framework | Guide |
|---|---|
| OpenAI Agents SDK | Connect OpenAI Agents |
| LangChain, LangGraph, or DeepAgents | LangChain, LangGraph, or DeepAgents |
| An application with OpenTelemetry | OpenTelemetry examples |
| Claude Code or Codex sessions | Coding agent sessions |
| Other frameworks through LiteLLM | Complete framework examples |
Run a real task, then open that trace and check its input, output, and expected steps. After traces arrive, you can create an investigation.
Optional: Copy the connect-an-agent prompt into your coding agent. Give it the Lens URL and framework. Keep the tracing key in your local environment, not in the prompt.
If the trace does not appear
| What happens | Next action |
|---|---|
| The model call fails | Check the model key, base URL, and model name. These are separate from Lens. |
The exporter returns 401 or 403 | Use a dedicated Lens tracing key. Check that it is active and belongs to this Lens deployment. |
| The exporter cannot connect | Check the full endpoint from the machine that runs the agent. Do not use localhost for Lens on another machine. |
| The call works, but Lens is empty | Check exporter errors, turn off demo data, and verify the selected agent and time range. |
| Another user cannot see the trace | Check the tracing key's user and team scope. Ask an administrator to verify access. |
| A framework trace lacks text | Enable the framework's content-capture setting if you intend to store prompt and response text. |
Link a run to its conversation
When a run starts from a conversation, such as a Slack thread, a Teams chat, or your own bot, set these attributes on the run's root agent span. Lens adds a Source field to the top of the trace with the app's logo, and hovering it shows the title.
| Attribute | Value |
|---|---|
agent.source.type | Where the conversation lives: slack, teams, discord, linear, github, jira, or custom. A missing or unknown value is treated as custom |
agent.source.url | An https:// link to the conversation, such as a Slack thread permalink. Other schemes are ignored |
agent.source.title | Short text shown when hovering the link, such as the thread's first message. Optional |
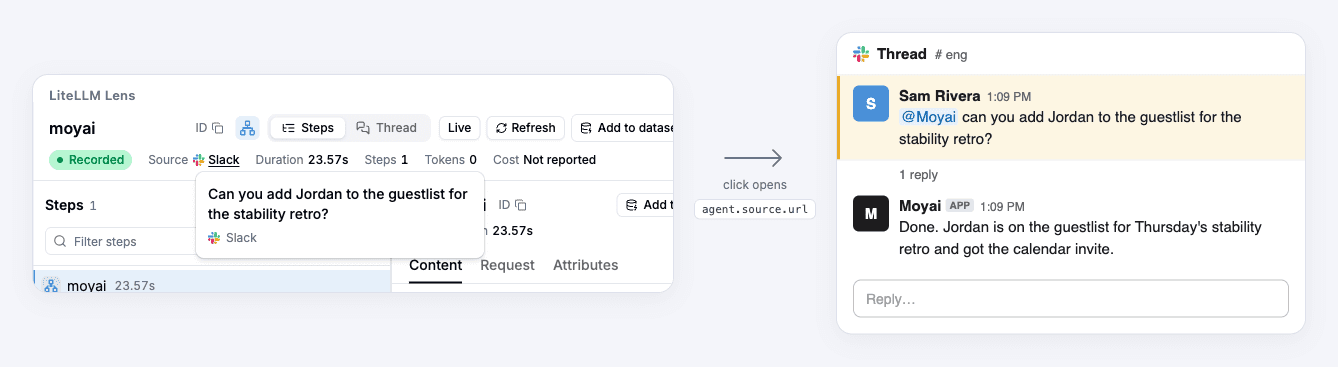
The type picks the logo and name, so slack shows the Slack logo and Slack. Use custom for your own bot or anything not listed. If the root span doesn't carry the attributes, Lens uses the earliest span that does.
with tracer.start_as_current_span("research_agent") as span:
    span.set_attribute("agent.source.type", "slack")
    span.set_attribute("agent.source.url", "https://acme.slack.com/archives/C0123ABCD/p1759869540000100")
    span.set_attribute("agent.source.title", "Can you add me to the guestlist for the retro?")
    run_agent(task)
The source is returned as summary.source, with type, url, and title, from the trace API.