Elasticsearch Logging with LiteLLM
Send your LLM requests, responses, costs, and performance data to Elasticsearch for analytics and monitoring using OpenTelemetry.
Quick Start
1. Start Elasticsearch
# Using Docker (simplest)
docker run -d \
  --name elasticsearch \
  -p 9200:9200 \
  -e "discovery.type=single-node" \
  -e "xpack.security.enabled=false" \
  docker.elastic.co/elasticsearch/elasticsearch:8.18.2
2. Set up OpenTelemetry Collector
Create an OTEL collector configuration file otel_config.yaml:
receivers:
  otlp:
    protocols:
      grpc:
        endpoint: 0.0.0.0:4317
      http:
        endpoint: 0.0.0.0:4318

processors:
  batch:
    timeout: 1s
    send_batch_size: 1024

exporters:
  debug:
    verbosity: detailed
  otlphttp/elastic:
    endpoint: "http://localhost:9200"
    headers:
      "Content-Type": "application/json"

service:
  pipelines:
    metrics:
      receivers: [otlp]
      exporters: [debug, otlphttp/elastic]
    traces:
      receivers: [otlp]
      exporters: [debug, otlphttp/elastic]
    logs:
      receivers: [otlp]
      exporters: [debug, otlphttp/elastic]
Start the OpenTelemetry collector:
docker run -p 4317:4317 -p 4318:4318 \
    -v $(pwd)/otel_config.yaml:/etc/otel-collector-config.yaml \
    otel/opentelemetry-collector:latest \
    --config=/etc/otel-collector-config.yaml
3. Install OpenTelemetry Dependencies
uv add opentelemetry-api opentelemetry-sdk opentelemetry-exporter-otlp
4. Configure LiteLLM
- LiteLLM Proxy
- Python SDK
Create a config.yaml file:
model_list:
  - model_name: gpt-4.1
    litellm_params:
      model: openai/gpt-4.1
      api_key: os.environ/OPENAI_API_KEY

litellm_settings:
  callbacks: ["otel"]

general_settings:
  otel: true
Set environment variables and start the proxy:
export OTEL_EXPORTER_OTLP_ENDPOINT="http://localhost:4317"
litellm --config config.yaml
Configure OpenTelemetry in your Python code:
import litellm
import os

# Configure OpenTelemetry
os.environ["OTEL_EXPORTER_OTLP_ENDPOINT"] = "http://localhost:4317"

# Enable OTEL logging
litellm.callbacks = ["otel"]

# Make your LLM calls
response = litellm.completion(
    model="gpt-4.1",
    messages=[{"role": "user", "content": "Hello, world!"}]
)
5. Test the Integration
Make a test request to verify logging is working:
- Test Proxy
- Test Python SDK
curl -X POST "http://localhost:4000/v1/chat/completions" \
  -H "Content-Type: application/json" \
  -H "Authorization: Bearer sk-1234" \
  -d '{
    "model": "gpt-4.1",
    "messages": [{"role": "user", "content": "Hello from LiteLLM!"}]
  }'
import litellm

response = litellm.completion(
    model="gpt-4.1",
    messages=[{"role": "user", "content": "Hello from LiteLLM!"}],
    user="test-user"
)
print("Response:", response.choices[0].message.content)
6. Verify It's Working
# Check if traces are being created in Elasticsearch
curl "localhost:9200/_search?pretty&size=1"
You should see OpenTelemetry trace data with structured fields for your LLM requests.
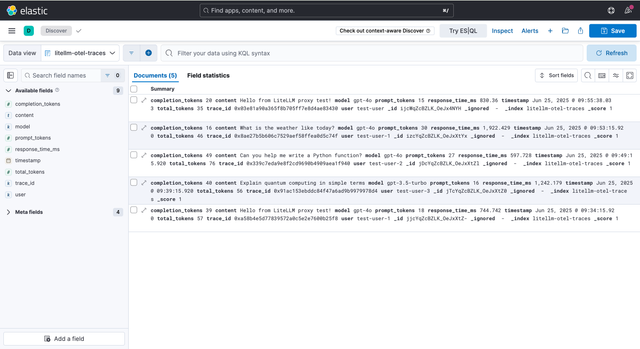
7. Visualize in Kibana
Start Kibana to visualize your LLM telemetry data:
docker run -d --name kibana --link elasticsearch:elasticsearch -p 5601:5601 docker.elastic.co/kibana/kibana:8.18.2
Open Kibana at http://localhost:5601 and create an index pattern for your LiteLLM traces:
Production Setup
With Elasticsearch Cloud:
Update your otel_config.yaml:
exporters:
  otlphttp/elastic:
    endpoint: "https://your-deployment.es.region.cloud.es.io"
    headers:
      "Authorization": "Bearer your-api-key"
      "Content-Type": "application/json"
Docker Compose (Full Stack):
# docker-compose.yml
version: '3.8'
services:
  elasticsearch:
    image: docker.elastic.co/elasticsearch/elasticsearch:8.18.2
    environment:
      - discovery.type=single-node
      - xpack.security.enabled=false
    ports:
      - "9200:9200"

  otel-collector:
    image: otel/opentelemetry-collector:latest
    command: ["--config=/etc/otel-collector-config.yaml"]
    volumes:
      - ./otel_config.yaml:/etc/otel-collector-config.yaml
    ports:
      - "4317:4317"
      - "4318:4318"
    depends_on:
      - elasticsearch

  litellm:
    image: docker.litellm.ai/berriai/litellm:latest
    ports:
      - "4000:4000"
    environment:
      - OPENAI_API_KEY=${OPENAI_API_KEY}
      - OTEL_EXPORTER_OTLP_ENDPOINT=http://otel-collector:4317
    command: ["--config", "/app/config.yaml"]
    volumes:
      - ./config.yaml:/app/config.yaml
    depends_on:
      - otel-collector
config.yaml:
model_list:
  - model_name: gpt-4.1
    litellm_params:
      model: openai/gpt-4.1
      api_key: os.environ/OPENAI_API_KEY

litellm_settings:
  callbacks: ["otel"]

general_settings:
  master_key: sk-1234
  otel: true