 AI GATEWAY / NOVEMBER 2026
Performance
alerts
See what changed
in your gateway.

Performance alerts flag spend spikes, traffic spikes, higher error rates, and slower responses in your gateway.
Open Alerts in LiteLLM to review findings alongside model deprecations. Monitoring is on by default for gateways with a database and recorded Usage. You do not need to write rules.

What triggers an alert
LiteLLM compares the last complete day with the previous seven days across your gateway, model groups, teams, users, and virtual keys.
- Spend spikes
- A rise in daily spend compared with your recent average.
- Traffic spikes
- A sharp increase in request volume.
- Slower responses
- Requests taking longer to complete.
- Error rates
- A larger share of requests failing.
These are daily findings based on recorded Usage. Detection is best effort, and missing Usage can affect the comparison.
Review an alert
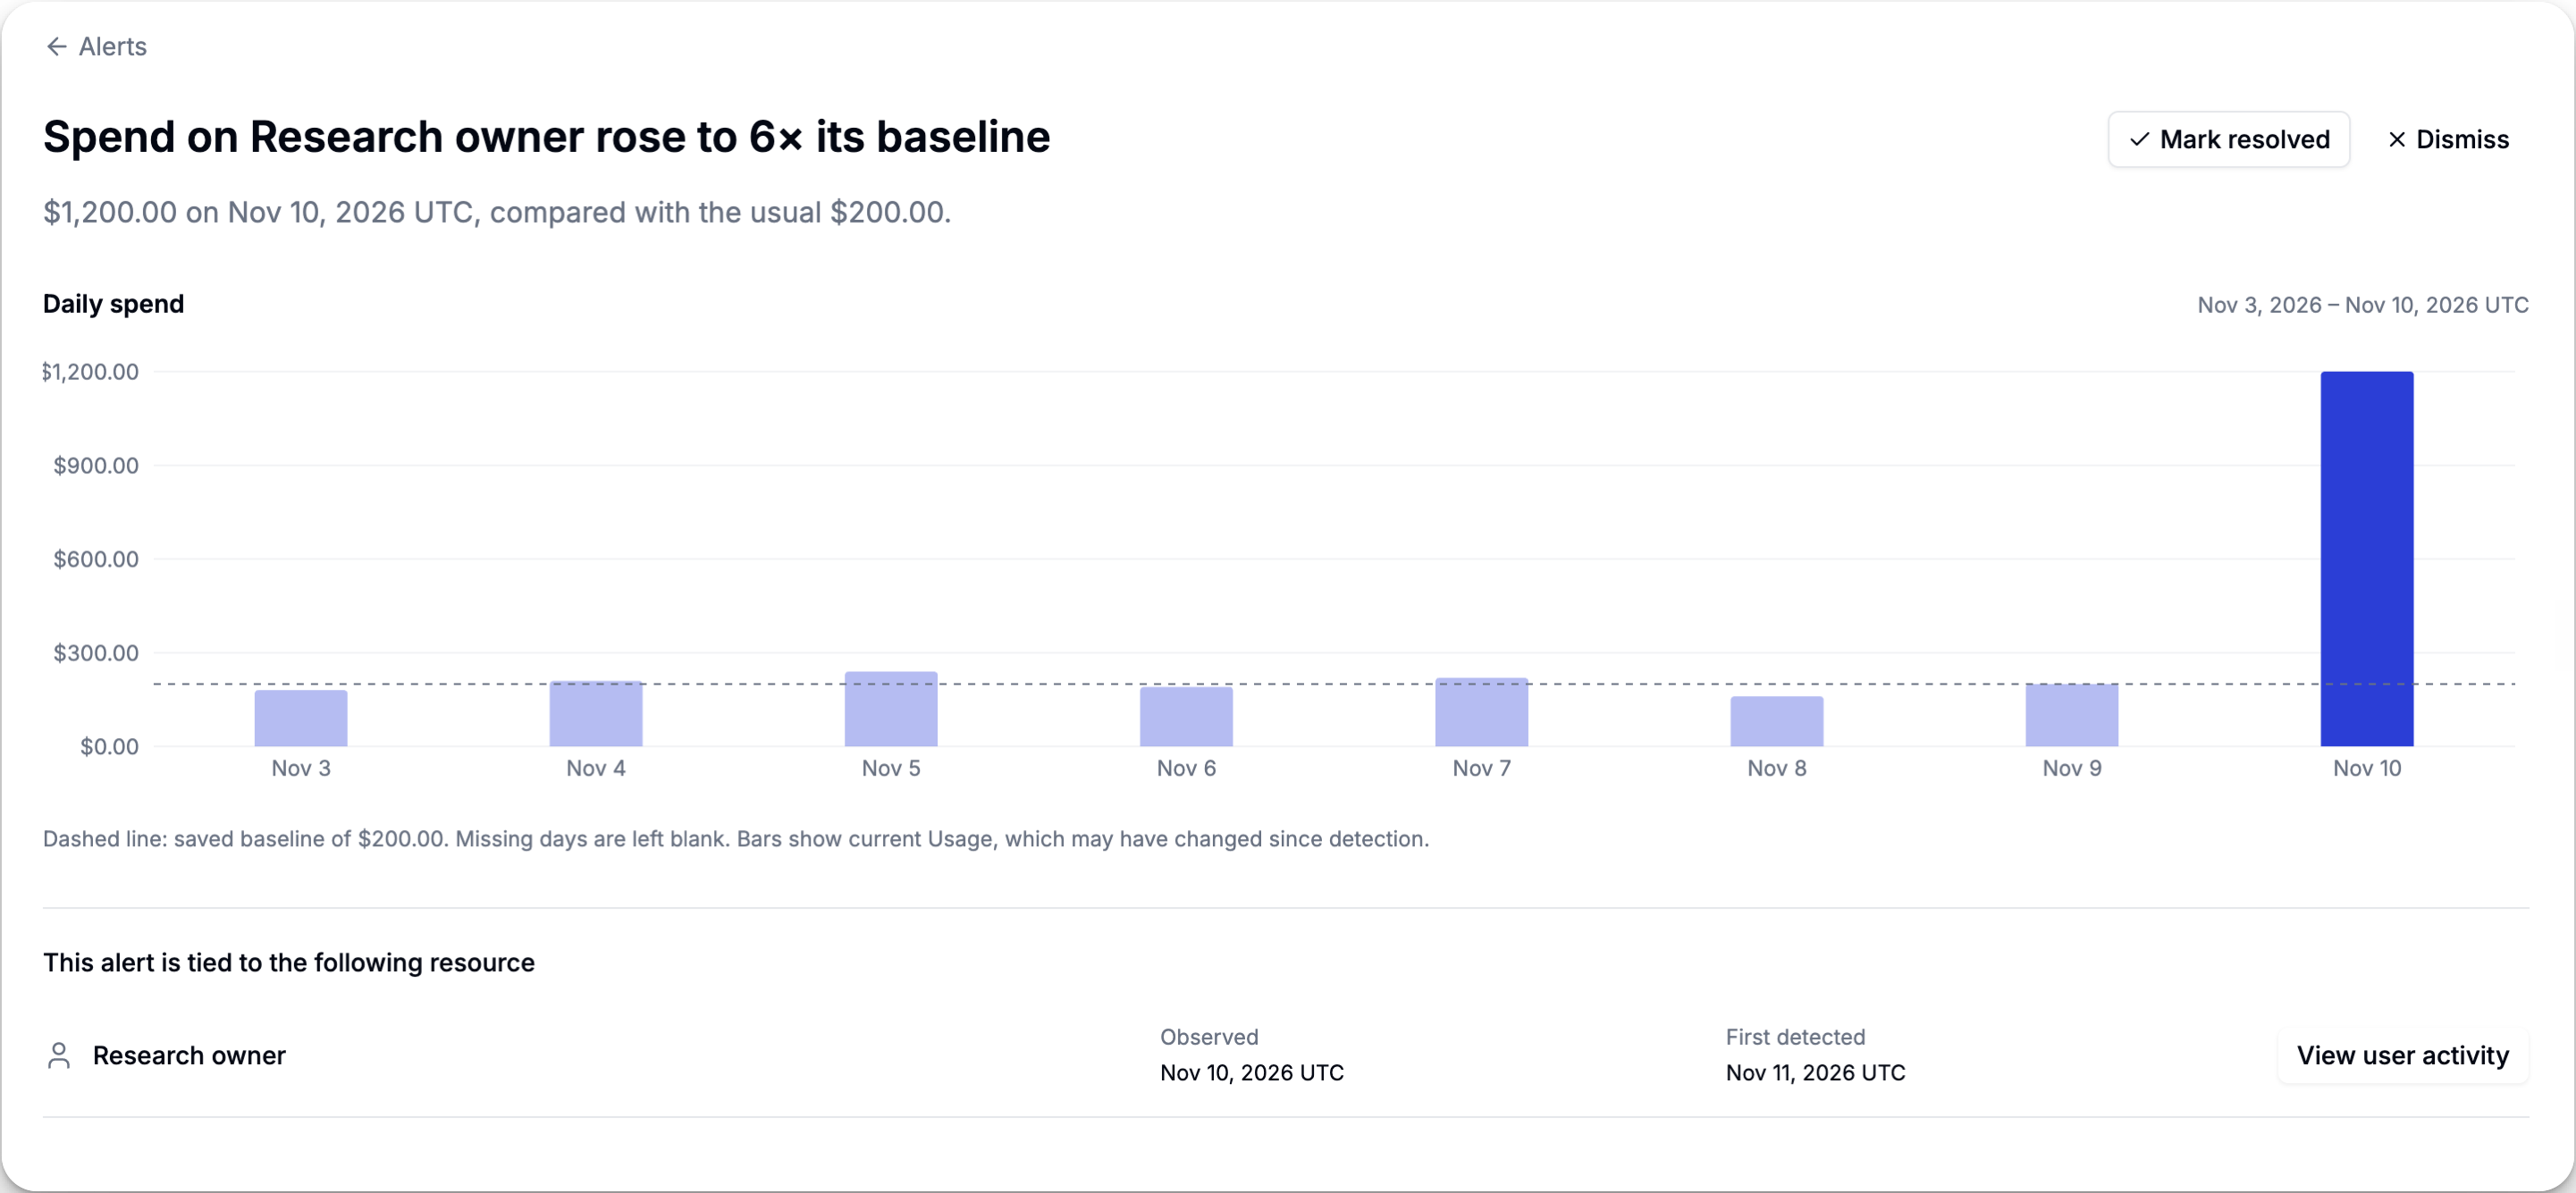
Select an alert to see the daily graph, the baseline, and the affected resource. Follow its link to inspect activity or model routing. Mark it resolved after addressing it, or dismiss it if no action is needed.
Notifications
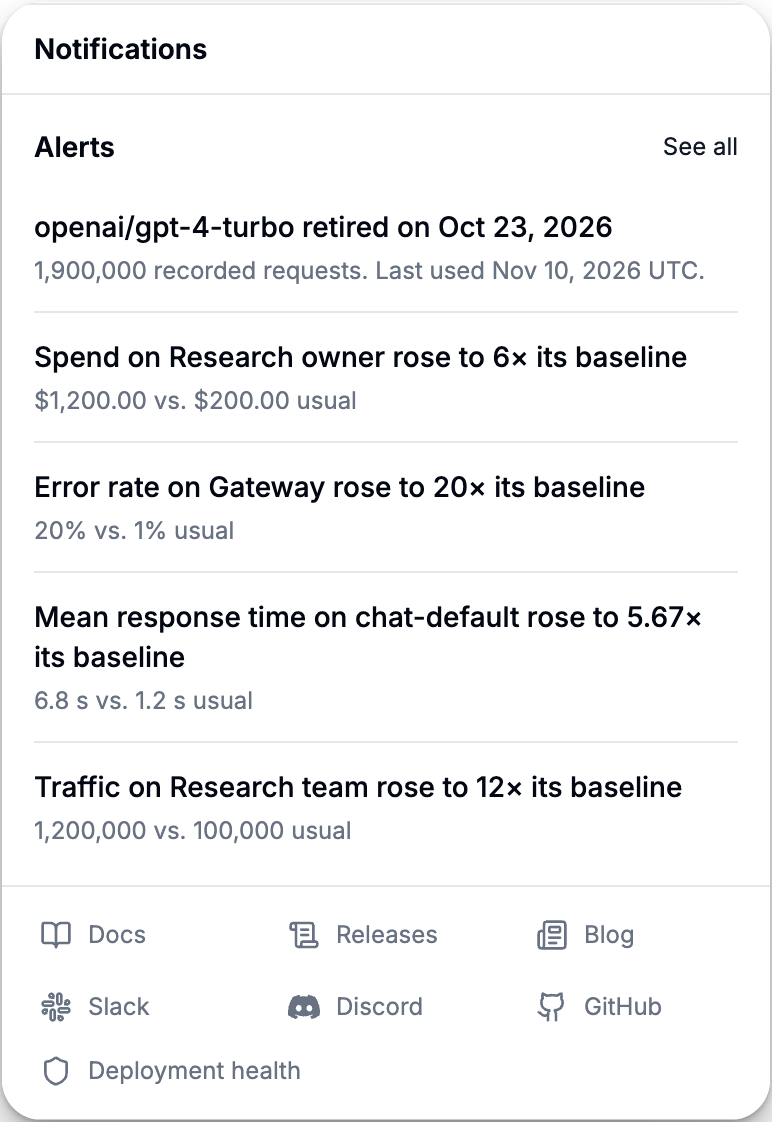
The notification bell shows up to five open alerts. Select one to open it, or See all for the full inbox.
Five free alerts
You get five saved performance alerts per gateway database. After the fifth, monitoring stops until you add an Enterprise license. Your saved alerts remain available.
Enterprise includes continued monitoring. Resolving or dismissing an alert does not reset the free allowance, and model deprecations do not count toward it.
You can opt out with the Performance monitoring switch on the Alerts page.