Databricks Zerobus
Send LiteLLM Gateway request logs to a Unity Catalog Delta table with Databricks Zerobus Ingest. Query model usage, latency, cost, and request metadata in Databricks, alongside your existing enterprise data.
This quickstart connects an existing LiteLLM Gateway deployment to Databricks. Create a destination table, configure service principal authentication, enable the integration, and verify a request made with a LiteLLM virtual key. You can configure the integration through your deployment's YAML configuration or the LiteLLM Admin UI.


 Zerobus IngestUnity Catalog
Delta table
LiteLLM buffers logs and sends JSON batches to the Zerobus REST API using OAuth client credentials. The default flush interval is 10 seconds, with an earlier flush when the queue reaches 100 rows.
Before you begin
You need an existing LiteLLM Gateway deployment, its HTTPS URL, and administrator access to configure logging. The gateway must already have a working model, and you need a LiteLLM virtual key authorized to call that model. Your gateway's cloud environment must allow outbound HTTPS connections to the Databricks workspace and Zerobus endpoints.
You also need a Databricks workspace with Unity Catalog in a supported Zerobus region, a catalog and schema for a managed Delta table, and access to a SQL warehouse or notebook compute. A Databricks administrator must be able to create a service principal and grant access to the destination.
Your Databricks user also needs USE CATALOG, USE SCHEMA, and SELECT to run the verification query. These reader privileges are separate from the ingestion principal's grants.
To configure the integration through the Admin UI, your deployment must have PostgreSQL connected and general_settings.store_model_in_db: true enabled. Sign in using your organization's configured authentication method with proxy administrator access.
The examples use my_catalog.my_schema.litellm_traces. Replace my_catalog and my_schema with your existing catalog and schema everywhere they appear. Screenshots show an example workspace using a Databricks-hosted model. Zerobus logging works with other supported model providers as well. Use your own workspace URL, ID, region, and service principal credentials.
1. Prepare gateway access
Get your gateway's HTTPS base URL and a virtual key from your platform administrator. If you manage keys, open Virtual Keys → + Create New Key in your deployed Admin UI, select the appropriate team and allowed model, and create a key with the budget and expiration required by your organization.
In the environment where you will send the verification request, set your deployment URL and virtual key:
export LITELLM_BASE_URL="https://litellm.example.com"
export LITELLM_API_KEY="<your-litellm-virtual-key>"
Replace the example domain with your deployed gateway URL, without a trailing slash or /v1 suffix. Note an existing model alias that this key can access; you will use it in step 6. The virtual key authenticates requests to LiteLLM. The Databricks service principal created below authenticates log delivery from the gateway to Databricks.
2. Identify your Databricks endpoints
Open the destination Databricks workspace. Copy the base URL from the address bar, excluding paths, query parameters, and fragments. The numeric o= parameter identifies the workspace. Find its region in the workspace switcher or the Databricks account console. See Databricks endpoint discovery.
| Value | Example format |
|---|---|
| Workspace URL | https://dbc-xxxxxxxx-xxxx.cloud.databricks.com |
| Workspace ID | The numeric value in ?o=<workspace-id> |
| Workspace region | For example, us-east-2 |
| Zerobus server endpoint on AWS | https://<workspace-id>.zerobus.<region>.cloud.databricks.com |
Include https:// in both URLs. The workspace URL authenticates the service principal; the Zerobus endpoint receives the logs. They must refer to the same workspace and region. Do not copy another workspace's ID or use the account ID. For Azure, use the endpoint ending in .azuredatabricks.net for your workspace.
3. Create the destination table
Generate the table definition using the same LiteLLM version as your deployed gateway. Run this command in the gateway's container or in an administration environment with the matching package version. Alternatively, use the full table definition below:
python - <<'PY'
from litellm.integrations.zerobus.row import create_table_sql

print(create_table_sql("my_catalog.my_schema.litellm_traces"))
PY
In Databricks, open SQL Editor, select a SQL warehouse, paste the generated statement, and run it to create a managed Delta table. You can also run it in a SQL notebook cell. Open Catalog, navigate to your table, and confirm that its columns match the generated definition.
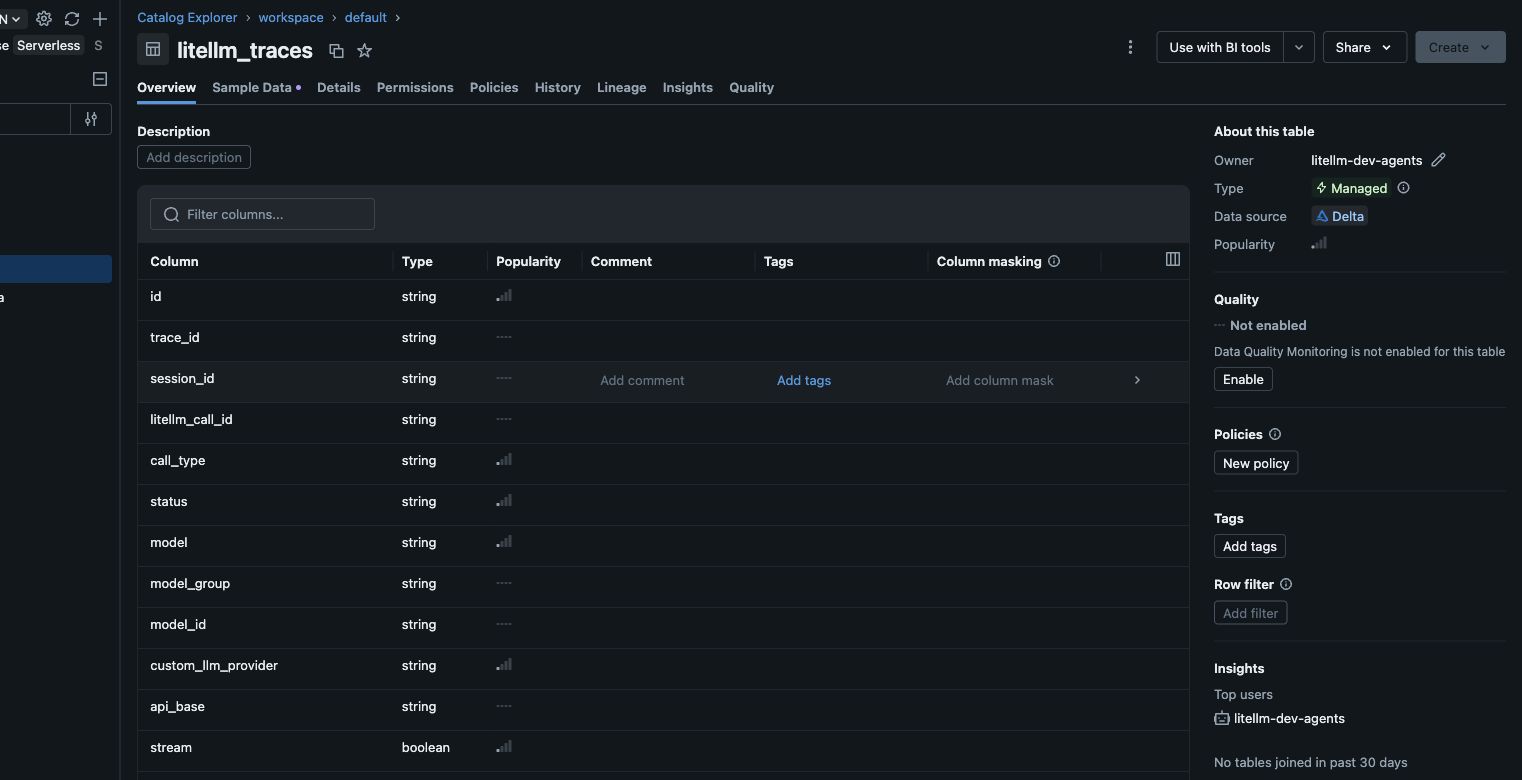
Create a dedicated Delta table with the schema generated by LiteLLM.
Full table definition
CREATE TABLE my_catalog.my_schema.litellm_traces (
  id STRING,
  trace_id STRING,
  session_id STRING,
  litellm_call_id STRING,
  call_type STRING,
  status STRING,
  model STRING,
  model_group STRING,
  model_id STRING,
  custom_llm_provider STRING,
  api_base STRING,
  stream BOOLEAN,
  cache_hit BOOLEAN,
  start_time TIMESTAMP,
  end_time TIMESTAMP,
  completion_start_time TIMESTAMP,
  response_time DOUBLE,
  prompt_tokens LONG,
  completion_tokens LONG,
  total_tokens LONG,
  response_cost DOUBLE,
  saved_cache_cost DOUBLE,
  api_key_hash STRING,
  api_key_alias STRING,
  team_id STRING,
  team_alias STRING,
  user_id STRING,
  org_id STRING,
  end_user STRING,
  requester_ip_address STRING,
  user_agent STRING,
  request_tags VARIANT,
  messages VARIANT,
  response VARIANT,
  error_str STRING,
  error_information VARIANT,
  metadata VARIANT,
  model_parameters VARIANT,
  hidden_params VARIANT,
  guardrail_information VARIANT,
  cost_breakdown VARIANT
);
If the table already exists, compare its schema with the generated DDL before continuing. Nested fields use VARIANT; a table created with these columns as STRING does not match this schema. LONG and BIGINT are equivalent Databricks SQL types.
4. Create the service principal and grant access
In the Databricks workspace, open Settings → Identity and access. Next to Service principals, select Manage, then Add service principal → Add new. Give it a descriptive name, such as litellm-zerobus. See Databricks service principal setup.
Open the service principal's Secrets tab and select Generate secret. Choose a lifetime and copy the client ID and secret to your secret store. The client ID is the principal's application ID; the secret is displayed only once. This integration requests the all-apis OAuth scope and restricts its ingestion token to the catalog, schema, and table below. See Databricks OAuth secrets.
Run the following SQL as a principal authorized to grant these privileges. Replace the application ID placeholder with the client ID you copied:
GRANT USE CATALOG ON CATALOG my_catalog
TO `<service-principal-application-id>`;

GRANT USE SCHEMA ON SCHEMA my_catalog.my_schema
TO `<service-principal-application-id>`;

GRANT SELECT, MODIFY ON TABLE my_catalog.my_schema.litellm_traces
TO `<service-principal-application-id>`;
Grant these privileges directly to the service principal. Group membership and a broad ALL PRIVILEGES grant do not replace the explicit grants used when LiteLLM requests the Zerobus token.
In Catalog, open the destination table's Permissions tab and confirm the principal has SELECT and MODIFY. Also verify USE CATALOG on the catalog and USE SCHEMA on the schema.
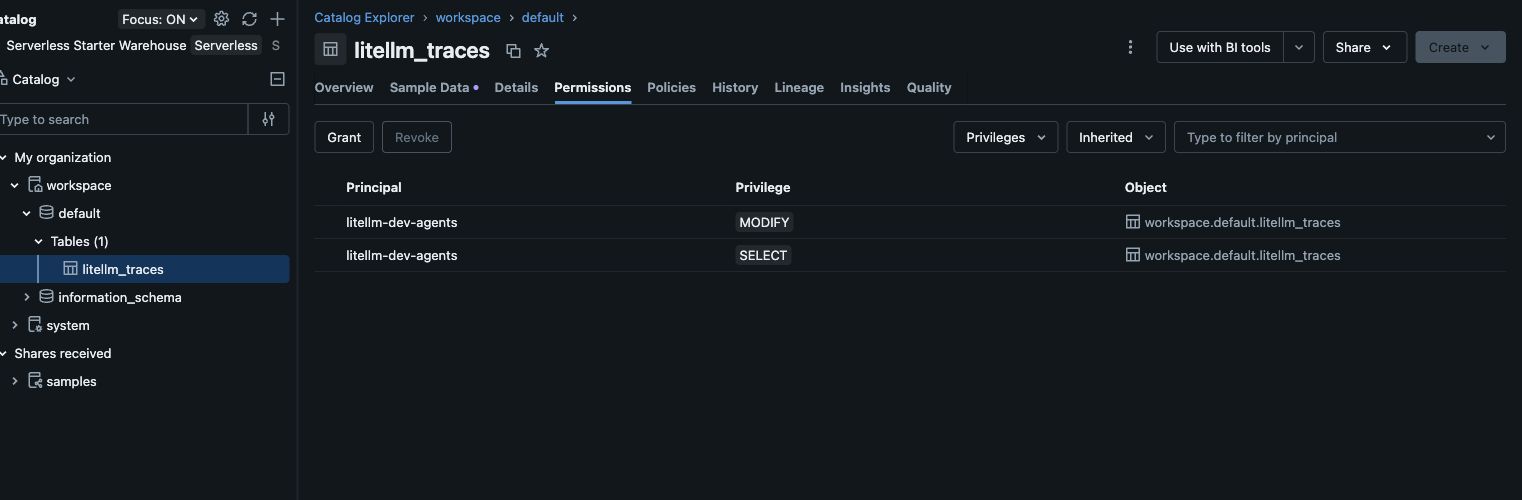
The ingestion principal needs explicit access to the catalog, schema, and table.
5. Connect the LiteLLM Gateway
Choose one configuration method. YAML enables logging for both successful and failed model calls. The Admin UI adds a success callback and logs successful calls; use YAML if you also need failed-call records.
Option A: Configure with YAML
Add the following environment variables to your gateway deployment through your platform's configuration and secret management system. Make them available to every gateway replica. Store the client secret as a secret and inject it at runtime.
| Gateway environment variable | Value |
|---|---|
ZEROBUS_WORKSPACE_URL | https://<your-workspace-host> |
ZEROBUS_SERVER_ENDPOINT | https://<workspace-id>.zerobus.<region>.cloud.databricks.com |
ZEROBUS_CLIENT_ID | The service principal's application ID |
ZEROBUS_CLIENT_SECRET | The service principal's OAuth secret, injected from your secret manager |
ZEROBUS_TABLE_NAME | my_catalog.my_schema.litellm_traces |
Merge the following into the configuration used by your deployment. If litellm_settings.callbacks already contains entries, append zerobus to that list and preserve your existing callbacks and other configuration:
litellm_settings:
  callbacks: ["zerobus"]
Apply the configuration and secret changes using your deployment's normal rollout process, and confirm that the gateway replicas become healthy.
LiteLLM reads the connection values from each gateway process's environment. Setting these variables only in the terminal used to send requests does not configure the deployed gateway. Missing required values fail callback initialization. Authentication and table access are checked when the first batch is sent, so continue through the verification steps after the rollout succeeds.
Option B: Configure in the Admin UI
Open your deployed Admin UI, for example https://litellm.example.com/ui, and sign in through your organization's configured authentication method. Your deployment must have PostgreSQL connected and general_settings.store_model_in_db: true enabled so that it can load the configuration saved through the UI. See the Admin UI guide for administrator access and SSO setup.
Open Settings → Logging & Alerts, select Add Callback, and choose Databricks Zerobus. Fill in the following fields:
| Field | Value |
|---|---|
| Workspace URL | The workspace base URL from step 2, including https:// |
| Zerobus Endpoint | The Zerobus URL for the same workspace, including https:// |
| Service Principal Client ID | The service principal's application ID |
| Service Principal Client Secret | The OAuth secret generated in step 4 |
| Table | my_catalog.my_schema.litellm_traces |
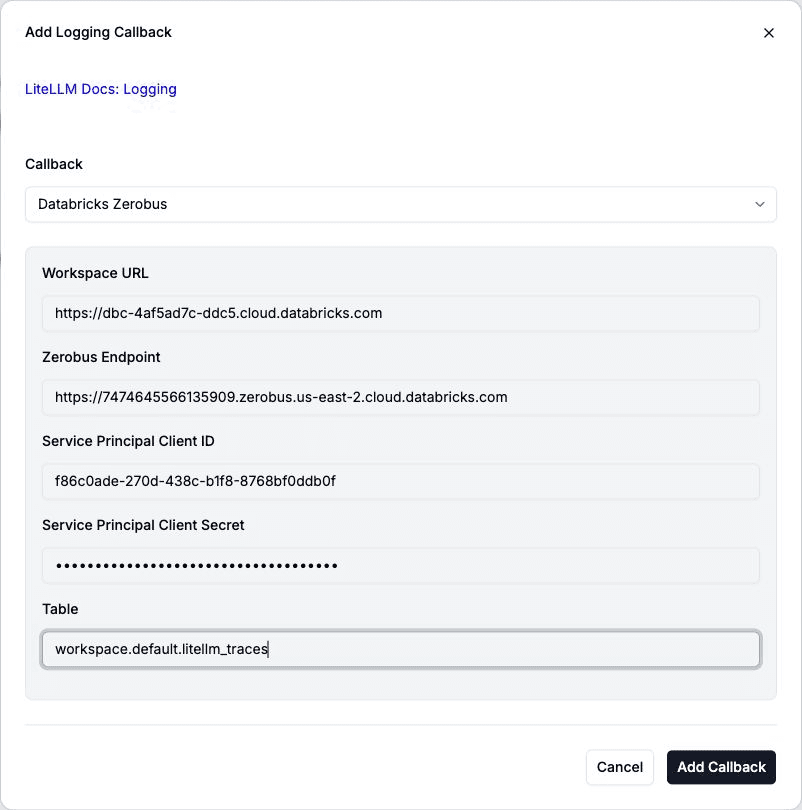
Enter all five connection values. The OAuth secret is masked in the form.
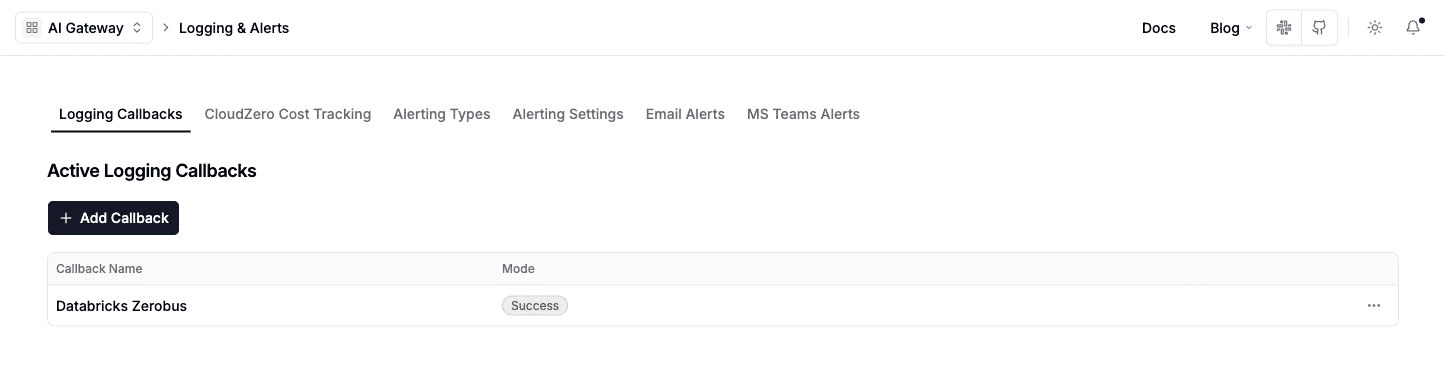
Select Add Callback. Confirm that Databricks Zerobus appears in the logging callbacks list. Saving the callback configures the integration; the request and SQL query below verify delivery.
6. Send a request through LiteLLM
From a client that can reach your deployed gateway, send a chat completion using the base URL and virtual key from step 1. Choose Python, JavaScript, or cURL below, and replace your-model-alias with an existing model alias authorized for that key. Each example sends the same request and prints its response ID.
- Python
- JavaScript
- cURL
Install the OpenAI Python SDK in your client environment:
python3 -m pip install openai
Save the following as zerobus_request.py:
import os
from openai import OpenAI

client = OpenAI(
    api_key=os.environ["LITELLM_API_KEY"],
    base_url=f'{os.environ["LITELLM_BASE_URL"]}/v1',
)

response = client.chat.completions.create(
    model="your-model-alias",
    messages=[
        {"role": "user", "content": "Reply with: Zerobus integration verified."}
    ],
    user="zerobus-quickstart",
    extra_body={"metadata": {"tags": ["zerobus-quickstart"]}},
)

print("Response ID:", response.id)
print("Assistant:", response.choices[0].message.content)
Run it from the environment where you set LITELLM_BASE_URL and LITELLM_API_KEY:
python3 zerobus_request.py
Install the OpenAI JavaScript SDK in your Node.js project:
npm install openai
Save the following as zerobus-request.mjs:
import OpenAI from "openai";

const client = new OpenAI({
  apiKey: process.env.LITELLM_API_KEY,
  baseURL: `${process.env.LITELLM_BASE_URL}/v1`,
});

const response = await client.chat.completions.create({
  model: "your-model-alias",
  messages: [
    { role: "user", content: "Reply with: Zerobus integration verified." },
  ],
  user: "zerobus-quickstart",
  metadata: { tags: ["zerobus-quickstart"] },
});

console.log("Response ID:", response.id);
console.log("Assistant:", response.choices[0].message.content);
Run it from the environment where you set LITELLM_BASE_URL and LITELLM_API_KEY:
node zerobus-request.mjs
This example uses cURL to send the request and jq to print the response ID and assistant message. Run it from the environment where you set LITELLM_BASE_URL and LITELLM_API_KEY:
curl --fail-with-body --silent --show-error \
  "${LITELLM_BASE_URL}/v1/chat/completions" \
  -H "Authorization: Bearer ${LITELLM_API_KEY}" \
  -H "Content-Type: application/json" \
  -d '{
    "model": "your-model-alias",
    "messages": [
      {"role": "user", "content": "Reply with: Zerobus integration verified."}
    ],
    "user": "zerobus-quickstart",
    "metadata": {"tags": ["zerobus-quickstart"]}
  }' > zerobus-response.json

jq -r '"Response ID: \(.id)", "Assistant: \(.choices[0].message.content)"' \
  zerobus-response.json
Save the printed response ID. The user value makes this request easy to find in the table's end_user column; metadata.tags labels the request for later analysis.
If your gateway has a database, open Logs in the Admin UI and select the request to inspect its status, token counts, and cost. Database request logs and Zerobus delivery are separate; verify the destination table in the next step.
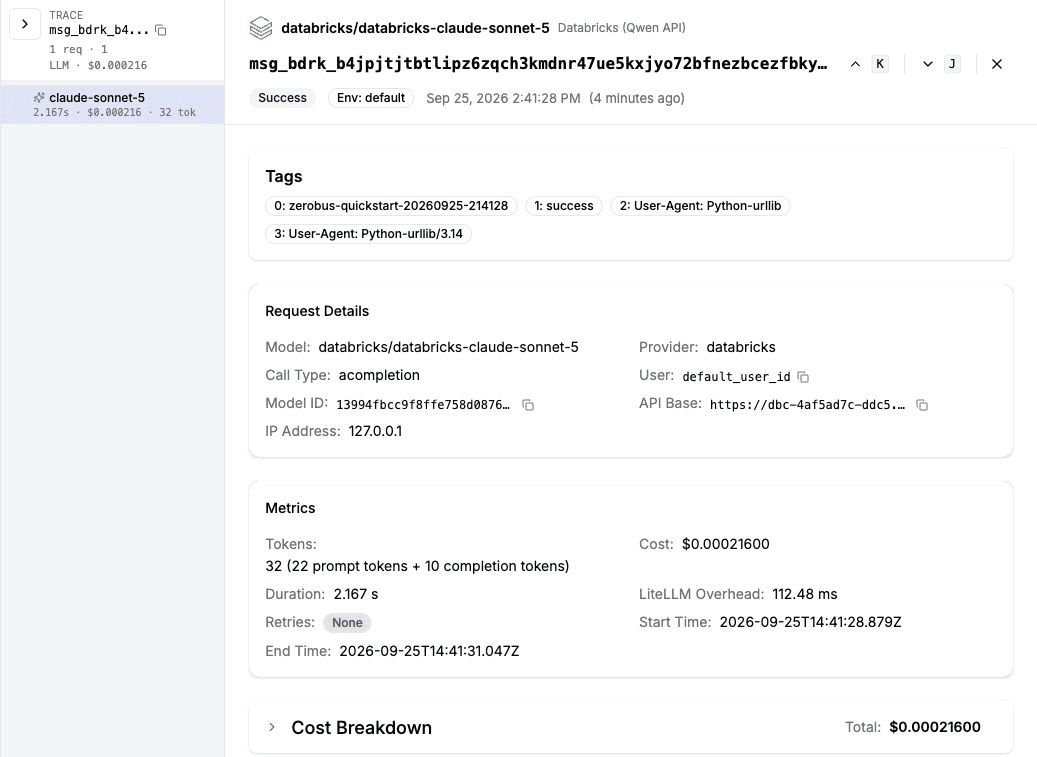
The example request used 22 prompt tokens and 10 completion tokens. Your model and usage can differ.
7. Verify the request in Databricks
With the defaults, allow at least 10 seconds for the next gateway flush, then allow for Databricks ingestion and query visibility. A successful model response by itself does not confirm delivery to the table.
In Databricks SQL Editor or a SQL notebook cell, run this query, replacing the response ID placeholder with the exact value returned in step 6:
SELECT
  id,
  status,
  model,
  end_user,
  prompt_tokens,
  completion_tokens,
  total_tokens,
  response_cost,
  start_time
FROM my_catalog.my_schema.litellm_traces
WHERE id = '<response-id-from-step-6>'
ORDER BY start_time DESC;
The result should include your response ID, status = 'success', end_user = 'zerobus-quickstart', and usage for the model call. Cost depends on the model's configured pricing. If no row appears, rerun the query after another flush interval and check the gateway logs using the troubleshooting table below.
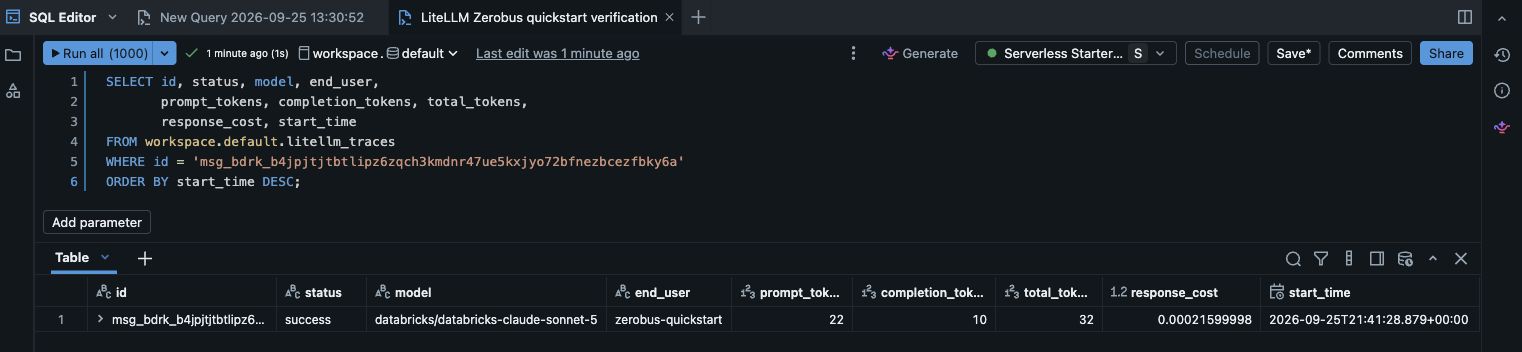
The query returns one successful row with the same token counts shown in LiteLLM.
To locate all quickstart requests:
SELECT id, status, model, end_user, total_tokens, response_cost, start_time
FROM my_catalog.my_schema.litellm_traces
WHERE end_user = 'zerobus-quickstart'
ORDER BY start_time DESC
LIMIT 20;
Configuration reference
The zerobus callback accepts optional settings under litellm_settings.zerobus_params. Connection parameters take precedence over their corresponding environment variables and support os.environ/VARIABLE_NAME references.
litellm_settings:
  callbacks: ["zerobus"]
  zerobus_params:
    workspace_url: os.environ/ZEROBUS_WORKSPACE_URL
    server_endpoint: os.environ/ZEROBUS_SERVER_ENDPOINT
    client_id: os.environ/ZEROBUS_CLIENT_ID
    client_secret: os.environ/ZEROBUS_CLIENT_SECRET
    table_name: os.environ/ZEROBUS_TABLE_NAME
    batch_size: 100
    flush_interval: 10
    turn_off_message_logging: true
| Parameter | Environment fallback / default | Description |
|---|---|---|
workspace_url | ZEROBUS_WORKSPACE_URL | Required. Workspace base URL used for OAuth. |
server_endpoint | ZEROBUS_SERVER_ENDPOINT | Required. Full Zerobus URL, including https://. |
client_id | ZEROBUS_CLIENT_ID | Required. Service principal application ID. |
client_secret | ZEROBUS_CLIENT_SECRET | Required. Service principal OAuth secret. |
table_name | ZEROBUS_TABLE_NAME | Required. Fully qualified catalog.schema.table. |
batch_size | 100 | Positive integer. Queue size that triggers an early flush. |
flush_interval | 10 | Positive integer. Seconds between periodic flushes. |
turn_off_message_logging | false | Redacts prompt and response content before enqueueing. |
batch_size is a flush trigger, not a maximum request size. A flush sends the queued rows, so a backlog can produce a larger batch.
Data and privacy
Each logged event contains scalar fields for request identity, status, model, timing, tokens, cost, and caller attribution. Nested values use VARIANT columns. Team, key, and organization fields depend on the virtual key and request context; they can be null when that context is absent. The API key column contains a hash, not the original key.
By default, logs include prompt and response content. Set zerobus_params.turn_off_message_logging: true to redact that content for both success and failure events while retaining operational fields. This setting does not remove every potentially sensitive field: review metadata, error text, user identifiers, and client information against your organization's logging policy. Store the OAuth secret in your deployment's secret manager and control access to the destination through Unity Catalog.
For example, aggregate spend and usage by team and model:
SELECT
  team_alias,
  model,
  COUNT(*) AS requests,
  SUM(total_tokens) AS tokens,
  SUM(response_cost) AS spend_usd
FROM my_catalog.my_schema.litellm_traces
WHERE start_time >= current_timestamp() - INTERVAL 1 DAY
  AND status = 'success'
GROUP BY team_alias, model
ORDER BY spend_usd DESC;
Delivery behavior
The integration sends logs asynchronously and keeps its queue in process memory. Network errors and HTTP 408, 429, 500, 502, 503, and 504 retain the batch for a later flush. An insert 401 discards the cached token and retries the batch with a fresh token. Other non-retryable responses drop the rejected batch and log the reason.
Retries can produce duplicate rows when a request was accepted but its response was lost. Process termination, permanent rejection, or queue overflow can lose logs. The queue is capped at 50,000 rows per logger, so this callback does not provide a durable delivery guarantee. Zerobus logging errors are handled separately from the model response. Monitor gateway logging failures and deduplicate by your request identifiers when building reports that require unique events.
LiteLLM acquires OAuth tokens automatically and refreshes them before expiry. When rotating a credential stored in the gateway process environment, update the deployed secret and restart the affected processes. When using the Admin UI, update the callback's connection settings.
Troubleshooting
Inspect your deployed gateway's container or service logs for zerobus: messages and CustomLogger batch flush messages. If more detail is needed, temporarily set LITELLM_LOG=DEBUG in the gateway deployment and apply the change through your normal rollout process. Restore the previous log level after diagnosing the integration because debug logs can contain request details.
| Symptom | What to check |
|---|---|
| Gateway fails to initialize the callback | Set all five required connection values. Include https:// in the endpoint and use a three-part table name. |
token request returned 401: invalid_authorization_details | Reapply the explicit grants from step 4 directly to the application ID. Confirm the table is in the workspace used to mint the token. |
| OAuth authentication fails | Check the client ID, secret value and expiry, workspace access, and the secret's ability to request the all-apis scope. |
insert returned 400 with an empty body | Check that the endpoint's numeric workspace ID and region belong to ZEROBUS_WORKSPACE_URL. An incorrect endpoint can cause this response. |
Record decoder/encoder error | Compare the destination columns and types with create_table_sql(...) from the running LiteLLM version, including the nested VARIANT fields. |
SQL Editor reports INSUFFICIENT_PERMISSIONS | The signed-in reader needs USE CATALOG, USE SCHEMA, and SELECT. Ingestion can succeed even when a different browser user cannot query the table. |
| Request succeeds but no row appears | Allow a flush interval plus ingestion time, rerun the query, and inspect the deployed gateway's token and insert errors. Confirm every replica has the integration configuration and the queried table matches ZEROBUS_TABLE_NAME. |
Test request returns 401 or 403 | Check that the virtual key belongs to this LiteLLM deployment, is valid, and is authorized for the requested model alias. |
| Successes appear but failures do not | The Admin UI registers a success callback. Use litellm_settings.callbacks: ["zerobus"] for success and failure events. Failures rejected before model-call logging may not produce a row. |
| Repeated retries or queue overflow | Check network reachability and Databricks responses. Resolve the destination error before the in-memory queue reaches its limit. |
See the LiteLLM logging guide for other callbacks and Databricks Zerobus Ingest for service configuration.