
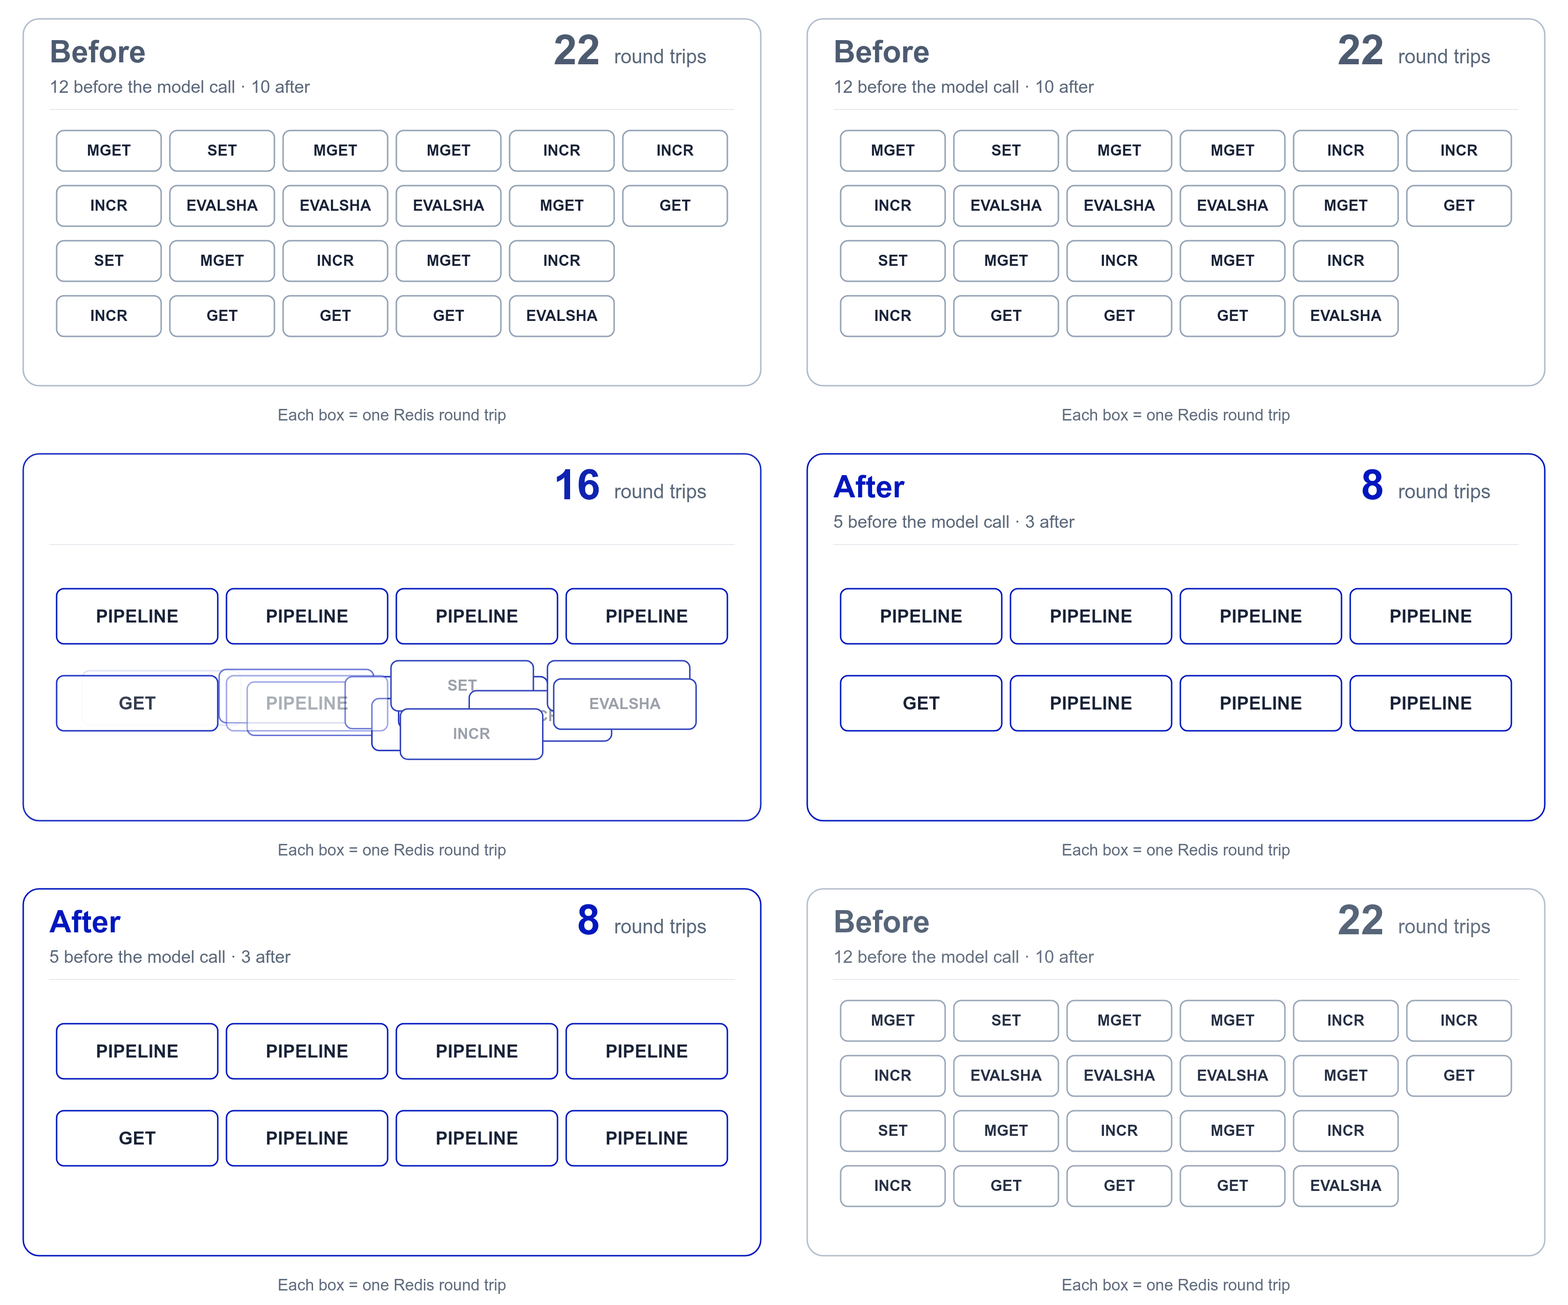
This week, we cut the number of times a request to the LiteLLM proxy waits on Redis from 22 to 8.
A request from a key with a budget, in a team with a budget and TPM/RPM limits, against a model group with usage-based routing and a Redis response cache, made 22 Redis round trips: 12 before the model was called and 10 after. The same request, with the same checks and the same writes, now makes 5 before and 3 after.
Redis round trips per request
14 fewer Redis round trips per request| Redis round trips | Before | After |
|---|---|---|
| Before the model call | 12 | 5 |
| After the model call | 10 | 3 |
| Streaming request | 24 | 8 |
| Response-cache hit | 18 | 7 |
| Once-a-minute auth refresh | 46 | 16 |
Why it was slow
Seven parts of the proxy talk to Redis on a request: auth, spend counters, budget reservation, the rate limiter, the router, the response cache, and the post-call accounting. Each one read what it needed, decided, wrote, and returned before the next one started. The rate limiter alone ran three Lua scripts one after another. Budget reservation re-read the spend counters auth had just read, then sent one increment per entity.
Of the 22 round trips, 5 carried information a decision depended on: the identity rows, the spend counters, the rate-limit scripts, the routing state and the response-cache lookup. The other 17 were re-reads of values already in hand, write-backs, and counter updates nothing waited for. Redis was never the bottleneck. The cost was waiting for the answer, 22 times in a row, on every request.
- MGETteam, membership
- SETwrite back
- MGETspend counters
- MGETsame counters
- INCRreserve key
- INCRreserve team
- INCRreserve end user
- EVALSHARPM check
- EVALSHAkey TPM
- EVALSHAteam TPM
- MGETcooldowns, usage
- GETresponse cache
- model call
- SETresponse cache
- MGETspend counters
- INCRsettle reservation
- MGETsame counters
- INCRother counters
- INCRdeployment TPM
- GETuser spend
- GETtag spend
- GETtag spend
- EVALSHAtoken usage
- PIPELINEidentity MGET + spend MGET
- PIPELINEreserve key, team, end user
- PIPELINEidentity write back + routing MGET + RPM check
- PIPELINEkey TPM + team TPM
- GETresponse cache
- model call
- PIPELINEspend counters
- PIPELINEuser, tag spend
- PIPELINEcache SET + 8 counter INCRs + deployment TPM + token usage
What we changed
Every request now owns one Redis batch per backend. Auth, the spend check, the rate limiter and the router declare their reads and scripts on it and get a handle back. The first time anyone awaits a handle, everything declared so far leaves as one pipeline, and every caller reads its own reply. The checks themselves did not move: budget rejects still happen in the budget code, rate-limit rejects in the rate limiter, in the same order as before.
Each subsystem reads, decides and writes before the next one starts
- AuthRead identity rows, write them back, read the spend counters
- BudgetsRead the same spend counters again, then reserve with three increments
- Rate limitsRun the RPM script, then the key TPM script, then the team TPM script
- Routing and cacheRead cooldowns and usage, pick a deployment, read the response cache
Declare, flush once, decide
- DeclareAuth, budgets, rate limits and routing queue their reads and scripts on the request batch and get a handle each
- FlushThe first await sends everything queued as one pipeline per Redis backend; every command gets its own reply
- DecideEach subsystem reads its reply and runs the same checks in the same order; a failed command fails only its owner
- SettleAfter the model call, writes collect in a post-call batch and leave in one pipeline once the callbacks finish
After the model responds, nothing waits on the writes, so they collect in a post-call batch: the response-cache write, the spend increments, the deployment usage counter and the rate limiter's token script. They leave in one pipeline when the success or failure callbacks finish. A one-second deadline flushes the batch if no callback closes it, and shutdown drains whatever is still pending, so a pod restart does not lose accounting.
Each command in a pipeline gets its own reply. A Lua script that is not loaded fails only its owner, which falls back to a direct call exactly as it did before. A pipeline that fails as a whole looks to every owner like Redis being unreachable, which they already handle. Redis Cluster clients keep making direct calls, since a cluster pipeline fans out per node. Requests that touch two Redis backends get one pipeline per backend, and the proxy and router caches share a pipeline when they point at the same server.
Redis round trips per request: 22 → 8
The same harness ran every endpoint shape the proxy governs the same way, with and without streaming, with usage-based and simple-shuffle routing, and with a response-cache hit. /v1/responses keeps one extra round trip on each side because its native handler still makes two synchronous cache calls from a worker thread.
| Request | Before | After |
|---|---|---|
/v1/chat/completions | 22 | 8 |
/v1/chat/completionsstreaming | 24 | 8 |
/v1/chat/completionssimple-shuffle routing | 22 | 8 |
/v1/messages | 21 | 8 |
/v1/responses | 26 | 9 |
/v1/chat/completionsresponse-cache hit | 18 | 7 |
Auth refresh requests: 46 → 16 Redis round trips
Auth keeps its management objects, the key, the end user, the team and the model-access registry, in memory for 60 seconds. On the first request after they expire, the proxy refreshed each one from Redis and then Postgres one call at a time: 16 serial Redis trips before routing started, the end user, the key and the registry each read twice, and the team alias deleted with a synchronous call on the event loop. That request cost 46 round trips instead of 22, once a minute for every active key.
The same request now reads whatever memory is missing with one MGET on the request pipeline, reads the team, and sends the write-backs and the alias delete as one pipeline behind it. The refresh is 3 trips, and the request as a whole went from 46 to 16 round trips for chat and from 40 to 14 for /v1/messages.
How we measured
We measured both versions on the same local proxy, from the commit before this work (27c110cb) to main with all five changes in it (13d004fc): Redis 6.0 and Postgres 14, mock deployments so the count does not depend on a provider, and a tracer that logs every Redis call and every pipeline flush with its caller. A pipeline or a Lua script counts as one round trip. Every sample was preceded by a warm-up request 12 seconds earlier, and the harness idles for 65 seconds every three samples so the 60-second cache expiry never lands inside a sample. For the refresh case, the harness sent a warm-up request, waited 65 seconds and traced the next one. All requests returned HTTP 200 in both arms.
See the changes: routing reads, spend counters, the pre-call pipeline, the post-call pipeline and the auth refresh.